Download presentation
Presentation is loading. Please wait.

1
Day 6 IDENTIFY ENERGY MANAGEMENT OPPORTUNITIES

2
Introduction The audit process flow chart shows several stages at which EMOs can be identified: At the Condition Survey stage, obvious needs for repair or operational changes that require no further assessment become apparent. When the facility Demand Profile is examined, other opportunities are identified that can reduce cost or consumption: for example, load-shifting opportunities that lower peak demand or loads that are on when the plant is down. The Load Inventory quantifies the distribution of energy consumption among plant systems and provides a basis for reconciling load with billings; variances in the reconciliation and insight into load distribution can lead to further EMOs. EMOs arising from the Condition Survey and Demand Profile are addressed elsewhere in the guide. This section outlines how to identify further EMOs and how to assess their feasibility and cost-effectiveness logically and systematically.

3
A Three-Step Approach to Identifying EMOs All energy-consuming equipment and systems were designed to meet a specific need or set of needs. This may be as simple as providing illumination or be far more complex, as in the case of an integrated processing plant. Finding EMOs involves reducing the level of energy use while still meeting the original need or requirement. The process of identifying EMOs begins at the point of end use where the need or requirement is met and works methodically back toward the point of energy purchase.

4
Step 1: Match Usage to Requirement The first and most important step in realizing savings opportunities is to match what is actually used to what is needed. The key consideration here is the duration of use and the magnitude of use. Questions that might be asked include the following: What is being done? Why is it being done? What energy is being consumed? What energy should be consumed? Does the process equipment idle for significant periods of time?

5
Step 2: Maximize system Efficiencies Once the need and usage are matched properly, the next step is to ensure that the system components meeting the need are operating as efficiently as possible. In this step, the effects of operating conditions, maintenance and equipment/technology will be considered. Questions to guide this aspect of the investigation include the following: Could it be done the same way but more efficiently? Are the principles underlying the process being correctly addressed? Why is there a difference?

6
Step 3: Optimize the Energy Supply The first two steps will reduce the requirement for energy. At this point it makes sense to seek the optimum source or sources for the net energy requirement. The final step in identifying savings opportunities is to consider the supply of energy to the system and to look for savings opportunities that you can achieve by optimizing the supply. Opportunities for optimization typically include the following. Heat Recovery Heat recovery systems utilize waste energy streams to displace inflowing energy. Such systems range from simple ducting of warm air to complex heat pump systems.

7
Heat Pumps In addition to facilitating heat recovery, heat pumps are used to exploit low-grade energy sources, such as geothermal energy (ground heat) and air. These are commonly called ground- source and air-source heat pumps. Cogeneration Cogeneration is often referred to as combined heat and power (CHP) systems. When facilities or processes require hot water and/or steam and at the same time have a demand for electrical energy, there may be an opportunity to supply both/all of them from fuel- fired combustion equipment. These systems take advantage of what would otherwise be waste energy. With a typical efficiency of 15% to 30% in converting fuel to electricity, the waste heat from the exhaust stream can provide the required thermal inflow to the appropriate facilities or processes; this can boost the overall efficiency by 50% to 80% or more.
 systems. When facilities or processes require hot water and/or steam and at the same time have a demand for electrical energy, there may be an opportunity to supply both/all of them from fuel- fired combustion equipment. These systems take advantage of what would otherwise be waste energy. With a typical efficiency of 15% to 30% in converting fuel to electricity, the waste heat from the exhaust stream can provide the required thermal inflow to the appropriate facilities or processes; this can boost the overall efficiency by 50% to 80% or more..")
8
Renewable Energy Systems Renewable energy, such as solar, wind or ground heat, can be used to supplement conventional energy sources. Although not always economical, certain applications of renewable energy may be cost-effective, including off- grid use of photovoltaic (solar-generated electricity) and wind energy as well as passive solar designs for new and existing buildings. Fuel Switching Fuel switching involves replacing one fuel with another, less expensive energy source. A good example would be converting hot water heating from electric to gas.
 and wind energy as well as passive solar designs for new and existing buildings. Fuel Switching Fuel switching involves replacing one fuel with another, less expensive energy source. A good example would be converting hot water heating from electric to gas..")
9
Purchase Optimization Purchase optimization takes full advantage of the open marketing of natural gas and electricity. Operations that understand what their energy use patterns are and how these patterns can be manipulated will benefit most from purchase optimization. It is important to recognize that the appropriate time to consider purchase optimization is after each of the preceding steps. It would be counter-productive, for example, to negotiate a new electricity supply contract before properly managing the facility's demand profile. Any future changes to the demand profile could make the new supply agreement less economical. Likewise, sizing a cogeneration system on the basis of existing electrical and thermal loads without good usage practices in place would be less than optimal. In fact, future reductions in thermal or electrical loads could make the cogeneration system uneconomical.

10
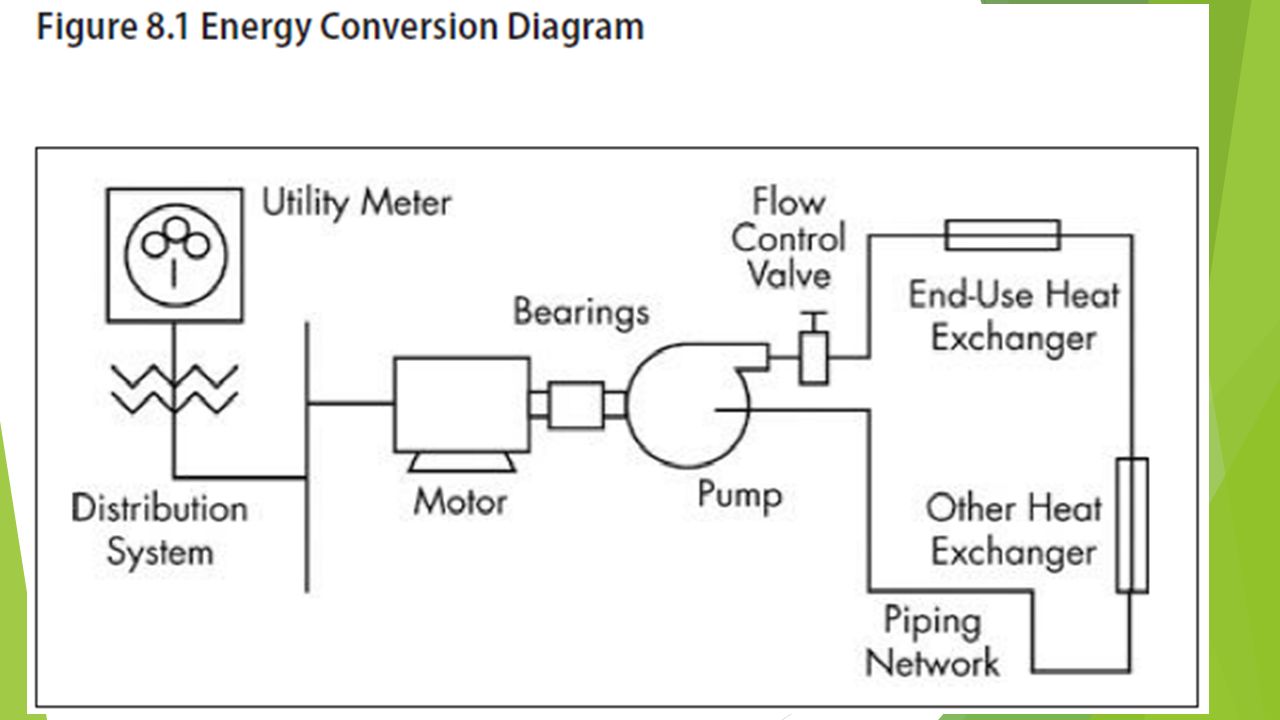
Actions at the Point of End Use Save More Where is the best place to begin to look for EMOs? This is a simple question with a simple answer: begin the search for opportunities where the energy is the most expensive - at the point of end use. Example: To illustrate this point, consider the case of a system designed to pump a fluid throughout a facility. In a commercial facility, this might be a chilled water pump for the air-conditioning system or for cooling process equipment. Figure 8.1 is a simplified picture of such a system, showing each component involved in the system's energy conversion. Energy passes through each system element, starting at the meter - the point of purchase - through to the heat exchanger in the terminal devices, where the cooling is required. Energy is constantly being converted and transferred.

12
Next, consider that the efficiency of each component is 100% or less. The meter would have an efficiency of very close to 100%, but other components are not as efficient. Efficiency is defined as the ratio of the output of a system or component to its corresponding input. Each component with an efficiency of less than 100% wastes the difference between the energy input and output. The result of this waste is that the unit cost ($/kWh or $/MJ) of the energy increases between the input and output. The unit cost of the energy at the output can be calculated as follows:
 of the energy increases between the input and output. The unit cost of the energy at the output can be calculated as follows:.")
13
Table 8.1 lists each of the components of the chilled water pumping system along with a description of the losses and an estimate of the typical energy efficiency of the component for a system of moderate size (10 to 100 hp).
.")
14
From the overall efficiency it can be seen that only one fifth of the energy actually gets to the point where it is required. In other words, the system needed five times the actual end- use energy requirement, which in this case is in the form of water movement, to overcome all the losses in the system. The impact on the unit cost of energy is illustrated in Table 8.2.

15
Clearly, the most expensive energy in the system is at the point of end use; this is where the greatest opportunity exists to impact the overall energy efficiency of the system and hence the cost of operation. Saving small amounts of energy in the piping network in this simple chilled water pumping system will result in significant savings - about five times more - at the point of purchase.

16
Cost Considerations Energy consumption can be reduced in two general ways: changing the operation of the existing systems and equipment changing the system or equipment technology Operational actions tend to cost less to implement; they are referred to as low-cost or housekeeping measures. In contrast, measures that require investment in new technology will tend to cost more to implement. These actions are often referred to as retrofit measures. The sequence of actions in this assessment is important. It does not make sense to install a new technology without clearly defining the requirement and properly sizing the equipment to meet that requirement. Similarly, the return on investment for a piece of energy- efficient equipment will depend on its operating times; any action that changes operating times must be considered first.

17
There is a range in cost when implementing energy-saving actions. A quadrant analysis considers two distinct action/cost categories: Lower cost - actions that could be funded from operational/expense budgets and tend to result from operational actions Higher cost - actions that may require capital funding and tend to involve the installation of equipment or new technology

18
The Waste-Loss Analysis combines these categories of actions into a table with four quadrants as numbered below. Examples given in the table are for a lighting system. Typically, actions that fall into the fourth quadrant have the highest cost; those in the first quadrant have the lowest. The relative cost of the second and third quadrants will vary depending on the specific actions and equipment.

19
A general form of the Waste-Loss Analysis table is presented below. In this case, actions have been generalized into broader categories that may exist in any energy-consuming system.

20
Special Considerations for Process Systems There is significant energy savings potential in actions that deal with operations and technology. Often, in the search for savings, much emphasis is placed on technological actions such as equipment retrofits and upgrades; however, many high-potential/low-cost operational opportunities are overlooked. Industrial energy use can be broken down into plant and process use. Plant use includes the supporting equipment and systems that supply the process equipment.

21
Many other types of systems may be present to provide for the energy needs of the process systems: ■ combustion systems ■ steam and hot water boilers and distribution ■ compressed air ■ lighting ■ refrigeration ■ pumps and fans (fluid movement) Applying the three-step critical assessment process requires us to determine how closely the process needs are being met. Then we can consider the energy use in the system designed to meet the requirement. To analyse the requirement, we must take a more in depth look at the internal workings of the process.

22
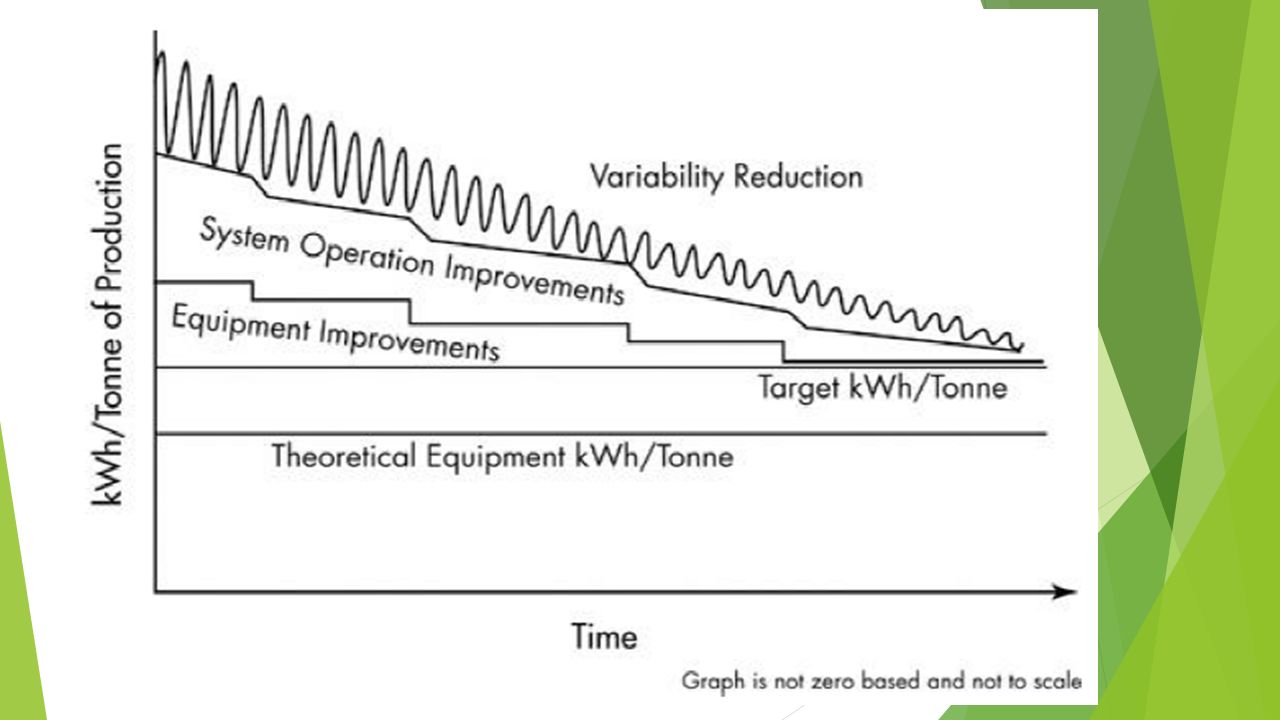
Figure 8.2 shows an example of the breakdown of process energy use in terms of the kilowatt- hours per tonne (kWh/tonne) ratio.
 ratio.")
23
Equipment kWh/tonne is defined as the energy required when the optimum amount of equipment is operating at design efficiency. System kWh/tonne is defined as the energy required when the operator and machine influences are included - this takes into account operational techniques and maintenance practices. Actual kWh/tonne is the energy use, taking into account any responses of the operators and supervisors to variations and external influences and the time lag in responding.

24
The differences between the various levels identified in Figure 8.2 represents potential for reduced energy use. Although it may not be possible to achieve a theoretical consumption level for a real process, a realistic target can be set. An energy audit or assessment on each process area would examine each of these levels and associated factors that influence consumption. Every manufacturing or industrial process presents opportunities for energy management. However, for the unwary, energy management also has the potential to create operational problems. The best way to avoid these problems is to involve operating staff in an auditing or assessment process.

25
The audit or assessment outcome will often include a set of actions that are operational and technological. Operational actions typically address variability and system consumption levels; technological actions reduce equipment consumption levels. It is expected that over time, as actions are implemented, various consumption levels will drop and actual consumption will approach the target level for the process (see Figure 8.3).
..")
27
Summary The method presented above is a means of looking at each of the energy¬consuming systems in your facility and identifying savings opportunities. The steps in the method are as follows: 1.Verify/validate energy need/requirement. 2.Conduct waste-loss analysis. 3.Optimize energy supply. Electrical and thermal inventories can provide valuable insight into finding savings opportunities and determining their extent. In Section C-2, "Details of Energy-Consuming Systems," typical systems in facilities are examined in terms of where energy losses occur and what can be done to minimize them. A Sankey diagram (as described in Section B-7) is provided for each system, followed by an application of the three-step method described in this section.
 is provided for each system, followed by an application of the three-step method described in this section..")
Similar presentations


 and Command Centers for Improved Operations and Increased Energy Efficiency Moderator:>")


