Download presentation
Presentation is loading. Please wait.

1
VPA Quarterly “ Howgozit ” First Quarter 2011 July 1, 2010 – 30 September 2010 Metric Assessments of Key Operating Areas “If you’re not keeping score, you’re just practicing”…..Vince Lombardi

2
1st Quarter Update—2010-11 Metrics to assess “how we’re doing” –Outcomes, measures of merit, completed tasks –Identify areas that need training, better guidance or process changes –‘Continuous Process Improvement’, mission accomplishment and institutional effectiveness –Provide the data assessment for Program Review at year’s end Evaluate division level performance, where possible –“Nothing personal….. just business”! Key Areas: –Classified Staffing (Requests for 2011 completed) –Finance/Budget—Update and metric review –Facilities and Support Services
 –Finance/Budget—Update and metric review –Facilities and Support Services.")
3
Classified Staffing Levels (less Child Development Center) 1 July 2010—30 Sep 2010
 1 July 2010—30 Sep 2010")
4
Classified Hiring 1 July 2010—30 Sep 2010

5
Good Classified New Hires Orientation

6
Classified Evaluations 1 July 2010—30 Sep 2010

7
Administrative Services Workshops April 10 WorkshopTopics Fiscal Close Out Budget update, 2010-11 Outlook Facility Use Modernization/Construction Update Q & A Next Workshop December 9, 2010 Budget update Financial Services Facilities Master Plan Fantasy Football Picks Other topics?? Q & A

8
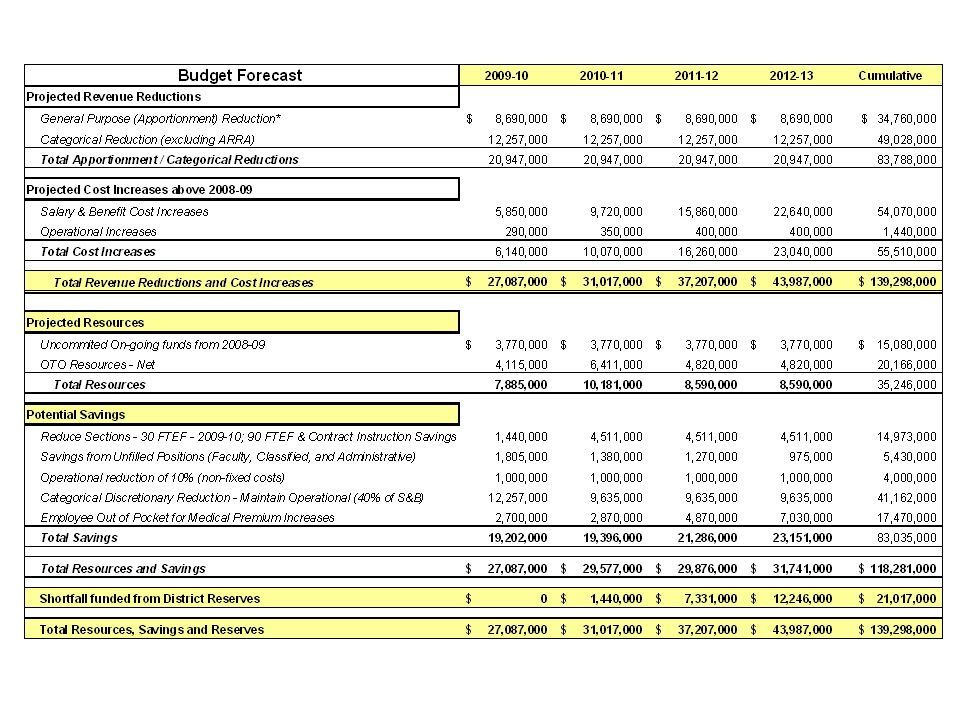
California State Budget Crisis Impact on Los Rios CCD—2010-11 General Purpose Reduction $ 8,690,000 Categorical Reduction $12,257,000 Total Reduction $-20,947,000 FINALLY, State budget approved, but.......! Categorical and Grant Programs Pending for 2010-11 College Planning based on these planning factors, plus...

9
Additional Increased Costs LRCCD 2010-11 Salary & Benefit Increases $9,720,000 Operational Increases 350,000 Total $10,070,000 2010-11 Shortfall $31,017,000 Three Year Outlook 10-11: $31.0M11-12: $37.2M12-13: $44.0M LRCCD Reserve Cumulative Impact = $21.0M

11
Sacramento City College Approach Utilize Strategic Planning SystemUtilize Strategic Planning System –Financial Resource Allocation Plan for guidance and process President’s Budget Memorandum, 11 Jan 2010 –Budget Committee Recommendations approved –2010-11 plan being executed –2011-13 outlook included, pending update Categorical Programs: Expect allocations similar to 2009-10 for 2010-11 –Small ARRA Funds ($5M); District reserves planned $1.4M –Objective: ~40% operational or students served –Selected programs: $587.4K (DSPS, EOPS, MATRIC)
; District reserves planned $1.4M –Objective: ~40% operational or students served –Selected programs: $587.4K (DSPS, EOPS, MATRIC)")
12
Sacramento City College Approach College Strategies –Multi-year planning and funding –Work toward carryovers –Reduce discretionary spending, e.g. travel, temp employees –Prioritize using College Goals and strategic direction Evaluate at Mid-Year –If supplemental dollars allocate or hold? –Allocate to budget committee, base allocations and/or above the line programs

13
Source of Funds 2010-11 + 2 September 2010 Update

14
Next Steps 2011-12 Planning Cycle + 2 Years LRCCD Adopted Budget (15 Sep 2010) –State budget complete October 2010…..but…..$10B? 2010-11 PDF Schedule (Nov 2010) Program Plan Review & Updates (Oct-Nov 2010) –Objectives and Resource Needs –Other Above the Line Unit Planning under way –Resource needs to budget committee (Spring 2011) Mid-Year Review (Jan 2011) President’s Budget Memorandum (Jan 2011) –2011-12 plus estimates for 2012-14
 Program Plan Review & Updates (Oct-Nov 2010) –Objectives and Resource Needs –Other Above the Line Unit Planning under way –Resource needs to budget committee (Spring 2011) Mid-Year Review (Jan 2011) President’s Budget Memorandum (Jan 2011) – plus estimates for")
15
College Discretionary Fund (CDF) Burn Rate 1 st Quarter: 1 July 2010 – 30 Sep 2010
 Burn Rate 1 st Quarter: 1 July 2010 – 30 Sep 2010")
16
Expenditure Comparison 1 st Qtr 1 July 2010—30 Sep 2010

17
Expenditure Comparison 3 rd Qtr 1 July 2009—31 March 2010

18
White Paper Usage 1st Quarter: 1 July 2010—30 Sep 2010

19
Instructionally-Related Fund (IR) Burn Rate 1 st Quarter: 1 July 2010 – 30 Sep 2010
 Burn Rate 1 st Quarter: 1 July 2010 – 30 Sep 2010")
20
Lottery Burn Rate 1 st Quarter: 1 July 2010—30 Sep 2010

21
Special Activities Fund Burn Rate As of 9/30/10 UnitAppropriationsExpendituresPercentage PRESIDENT 14,5003,62725% Vice President Administration 7,50000% Vice President Instruction 15,0001,0397% Vice President Student Services 18,0002,59414% TOTAL55,0007,26013%

22
Categorical Program Burn Rate 1 st Quarter: 1 July 2010 – 30 Sep 2010

23
Categorical Program Burn Rate 1 st Quarter: 1 July 2010 – 30 Sep 2010

24
VTEA AVP Categorical Program Burn Rate 1 st Quarter: 1 July 2010—30 Sep 2010

25
Basic Skills AVPI Categorical Program Burn Rate 1 st Quarter: 1 July 2010—30 Sep 2010

26
Absence Reports Year to Date 30 Sep 2010

27
Intents Year to Date 30 Sep 2010

28
Travel Authorizations Year to Date 30 Sep 2010

29
Budget Entries Year to Date 30 Sep 2010

30
Requisitions Year to Date 30 Sep 2010

31
College Totals Year to Date 30 Sep 2010

32
Textbook Requisitions Year to Date 30 Sep 2010

33
SCC Waste Diversion Report Year-to-Date 9/30/10

34
SCC Copier Usage Apr 09 - Sep 09 vs Apr 10 - Sep 10

35
SCC Building Summary Year-to-Date 9/30/10

36
Summary & Closing Thoughts Continuous Process improvement is the goal –Metric data provides the feedback loop that lets us target the improvement effort –Your feedback is important and welcomed Budget challenges remain, but…. –SCC trends are positive, encouraging –Management effort evident in controlling costs and working with the financial constraints— BRAVO!! Building the 2010-11 Budget Plan Plus 2 –Utilize the Financial Resource Plan –Dependent on State Budget and District inputs Keep up the Great Work!Keep up the Great Work!

Similar presentations


 845-8772 ~~~~~~~~~~~~~~~~~~~~~~~>")


