Download presentation
Presentation is loading. Please wait.

1
Population Geography I

2
a. Demography: The study of human populations

3
b. Cohort: A population group unified by a specified common characteristics

4
c. Census: A detailed counting of the population that occurs in the US every ten years per the US Constitution

5
POPULATION STATISTICS

6
a. Life expectancy: The average length of a person’s life

7
b. Crude birth rate (CBR): Number of live births per 1,000 people
: Number of live births per 1,000 people")
8
c. Total fertility rate (TFR): The average number of children born to each woman over her lifetime d. Replacement fertility rate: When the TFR is ≥ 2.1
: The average number of children born to each woman over her lifetime d. Replacement fertility rate: When the TFR is ≥ 2.1.")
10
e. Crude death rate (CDR): Number of deaths per 1,000 people
: Number of deaths per 1,000 people")
11
f. Infant mortality rate: Percentage of children who die before their first birthday

12
g. Child mortality rate

13
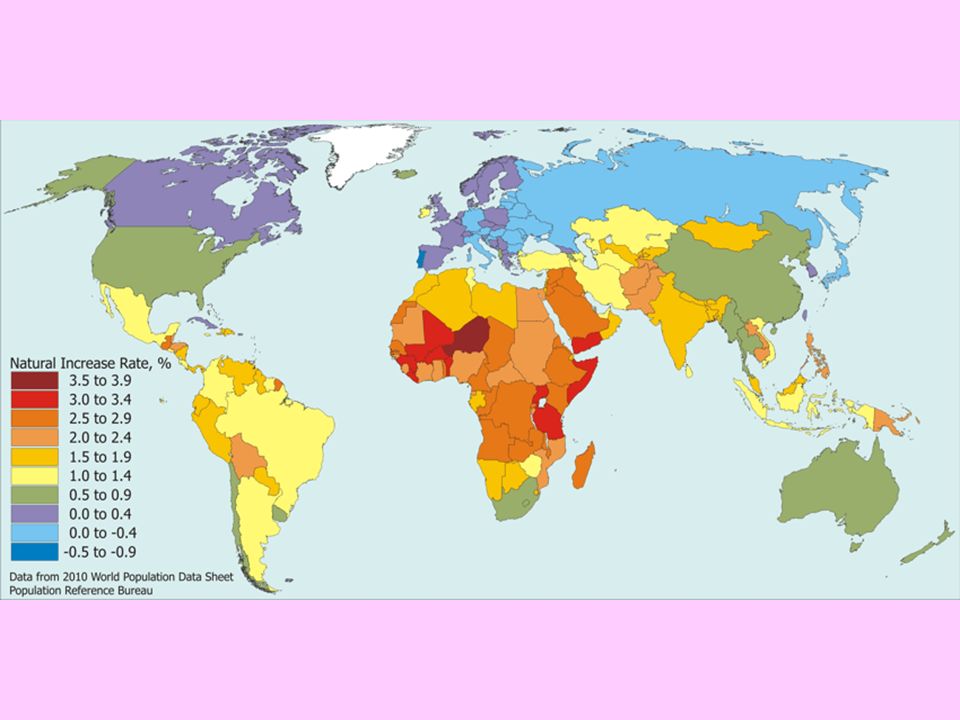
h. Natural increase rate (NIR): CBR – CDR (annually) 1) In developed regions (North America, East Asia, Europe) NIR is negative 2) In developing regions (Africa, Asia, Latin America) NIR is positive
: CBR – CDR (annually) 1) In developed regions (North America, East Asia, Europe) NIR is negative 2) In developing regions (Africa, Asia, Latin America) NIR is positive.")
14
Rates of birth, death, and natural increase per 1,000 population Natural Increase Source: United Nations, World Population Prospects: The 2004 Revision, 2005. Birth and Death Rates, Worldwide

16
Factors that determine a population’s NIR: Economic development Cultural traditions Education Government policy Gender equality Healthcare

17
i. Population Density: The relationship between number of inhabitants and area they occupy 1) Arithmetic: Number of people ÷ total land area 2) Physiological: Number of people total amount of arable land
 Arithmetic: Number of people ÷ total land area 2) Physiological: Number of people total amount of arable land.")
18
j. Demographic Accounting Equation: Summarizes the amount of growth or decline in a population within a country during a particular time period taking into account both natural increase and net migration. Formula: P = (B - D) + (I - E) (P = population; B = births; D = deaths; I = immigration; E = emigration)
 + (I - E) (P = population; B = births; D = deaths; I = immigration; E = emigration).")
19
POPULATION CHANGE OVER TIME

20
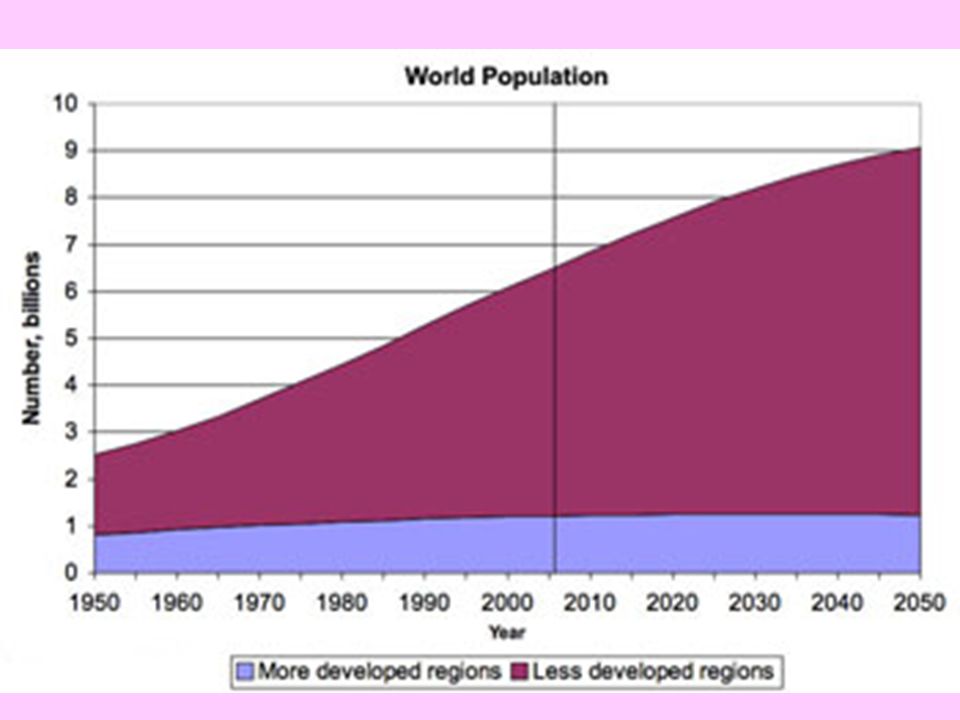
a. Human population is increasing even though growth rate is decreasing.

21
Sources: UN Population Division and Population Reference Bureau.

22
A.D. 2000 A.D. 1000 A.D. 1 1000 B.C. 2000 B.C. 3000 B.C. 4000 B.C. 5000 B.C. 6000 B.C. 7000 B.C. 1+ million years 8 7 6 5 2 1 4 3 Old Stone Age New Stone Age Bronze Age Iron Age Middle Ages Modern Age Black Death—The Plague 9 10 11 12 A.D. 3000 A.D. 4000 A.D. 5000 1800 1900 1950 1975 2000 2100 Future Billions Source: Population Reference Bureau; and United Nations, World Population Projections to 2100 (1998). World Population Growth Through History
. World Population Growth Through History.")
23
b. Doubling time: Time period required for a population to double Formula: DT = 70 ÷ NRI

24
c. J-Curve: The curve of world population due to exponential population growth (compounded growth)
")
25
d. S-Curve: The curve as humans hit consistently higher homeostatic plateaus as they increase the carrying capacity of the earth through technological advances

27
e. Population Explosion: The large worldwide population growth 1800-2000

28
Why ?? 1) Life expectancy and birth rates increasing because of industrialization, technology, and medical innovations (epidemic diseases used to be the #1 global killer; it is now non-communicable diseases, which are predicted to account for 50% of all global deaths by 2030) 2) Population growth is compounded (3% of next year’s pop will be > 3% of this year’s) 3) Population (Demographic) Momentum: Number of births increase even as TFR decreases because of the % of women reaching child-bearing ages
 Life expectancy and birth rates increasing because of industrialization, technology, and medical innovations (epidemic diseases used to be the #1 global killer; it is now non-communicable diseases, which are predicted to account for 50% of all global deaths by 2030) 2) Population growth is compounded (3% of next year’s pop will be > 3% of this year’s) 3) Population (Demographic) Momentum: Number of births increase even as TFR decreases because of the % of women reaching child-bearing ages.")
29
f. Population Implosion: The recent slowing down of the world’s population growth rate due to decreased birth rates in rich nations 1) Declining birthrates: TFR = 5 in 1950; TFR = 2.4 in 2012 (ranging from 1.1 in Latvia to 7.1 in Niger) 2) Longer life expectancies: Estimated that by 2050, one out of every six people will be > 60
 Declining birthrates: TFR = 5 in 1950; TFR = 2.4 in 2012 (ranging from 1.1 in Latvia to 7.1 in Niger) 2) Longer life expectancies: Estimated that by 2050, one out of every six people will be > 60.")
31
Population Proportion 65+, 2010-2040

32
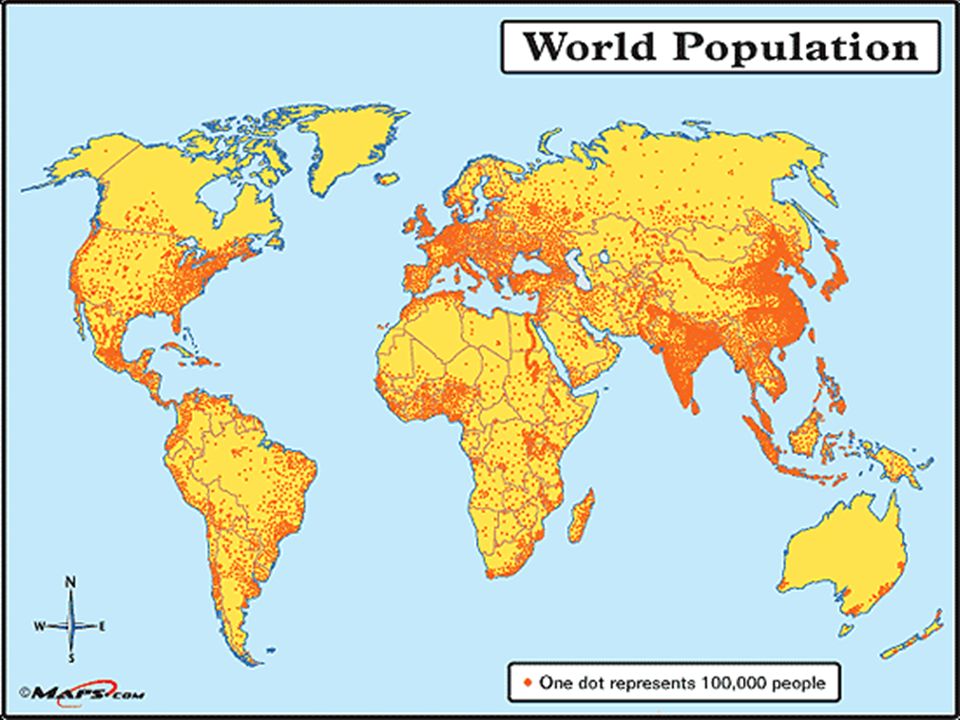
POPULATION DISTRIBUTION

33
a. Ecumene: Inhabitable area of the earth’s surface b. Nonecumene: Uninhabited or very sparsely populated area of the earth’s surface

35
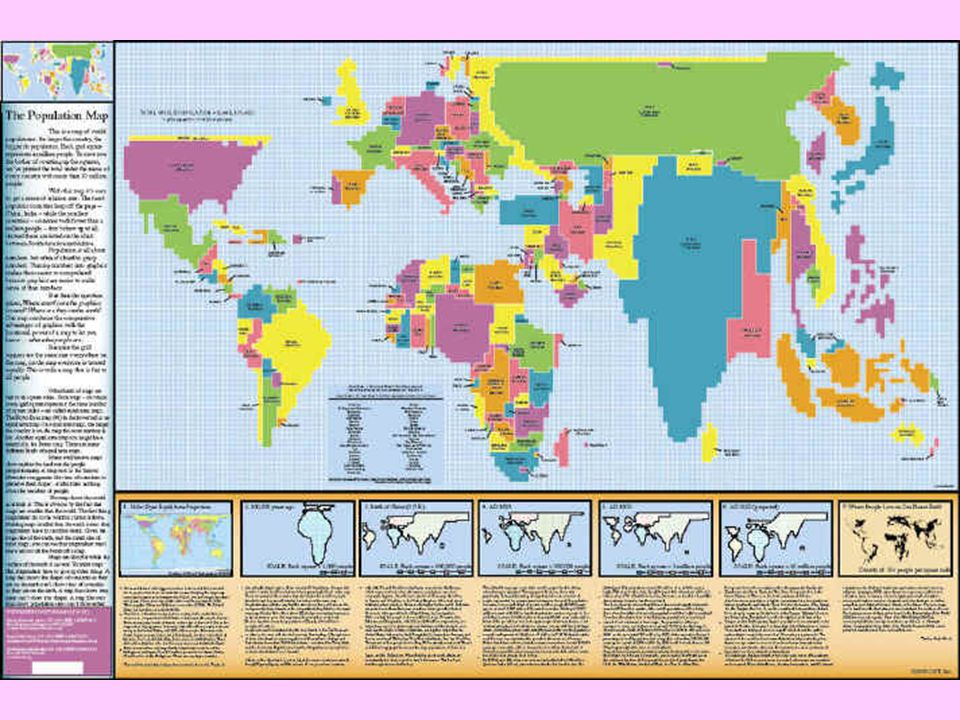
c. Approximate world population: 7.1 billion 1)80% of the world’s population lives in less- developed countries; currently 97% of births are in Africa, Asia or Latin America 2)1/3 of the world’s population live in two countries: China and India 3)About 60% of the world’s population is Asian
80% of the world’s population lives in less- developed countries; currently 97% of births are in Africa, Asia or Latin America 2)1/3 of the world’s population live in two countries: China and India 3)About 60% of the world’s population is Asian.")
38
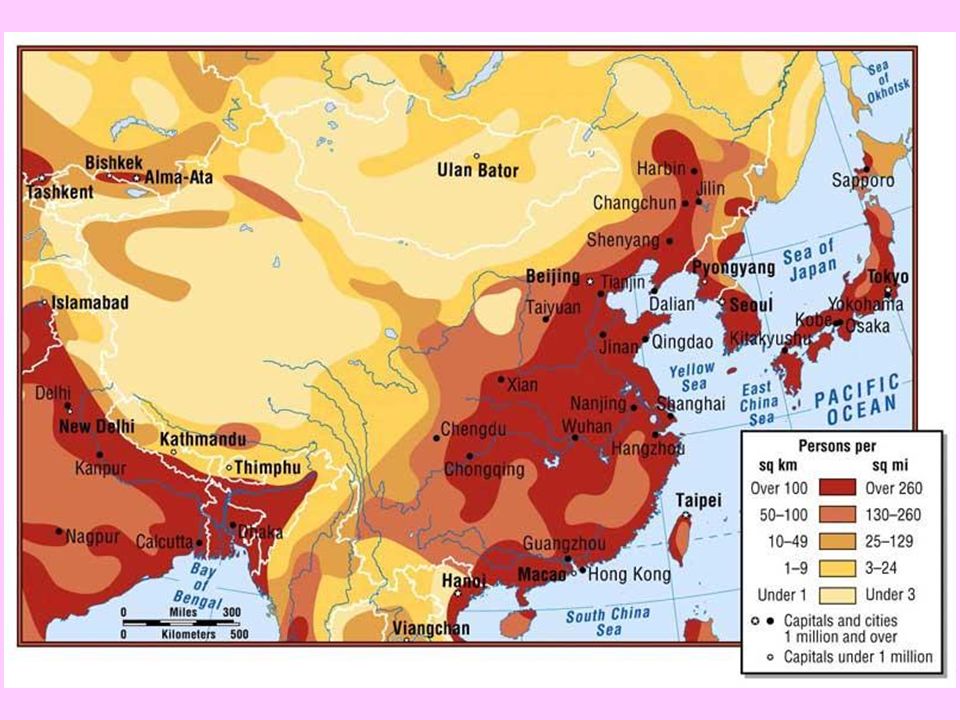
d. East Asia 1) 1/5 of the world’s population 2) China is the most populous country (1.35 billion) 3) China’s population clustered on east coast (2/3 in rural areas); Japan and Korea’s are clustered in urban areas
 1/5 of the world’s population 2) China is the most populous country (1.35 billion) 3) China’s population clustered on east coast (2/3 in rural areas); Japan and Korea’s are clustered in urban areas.")
40
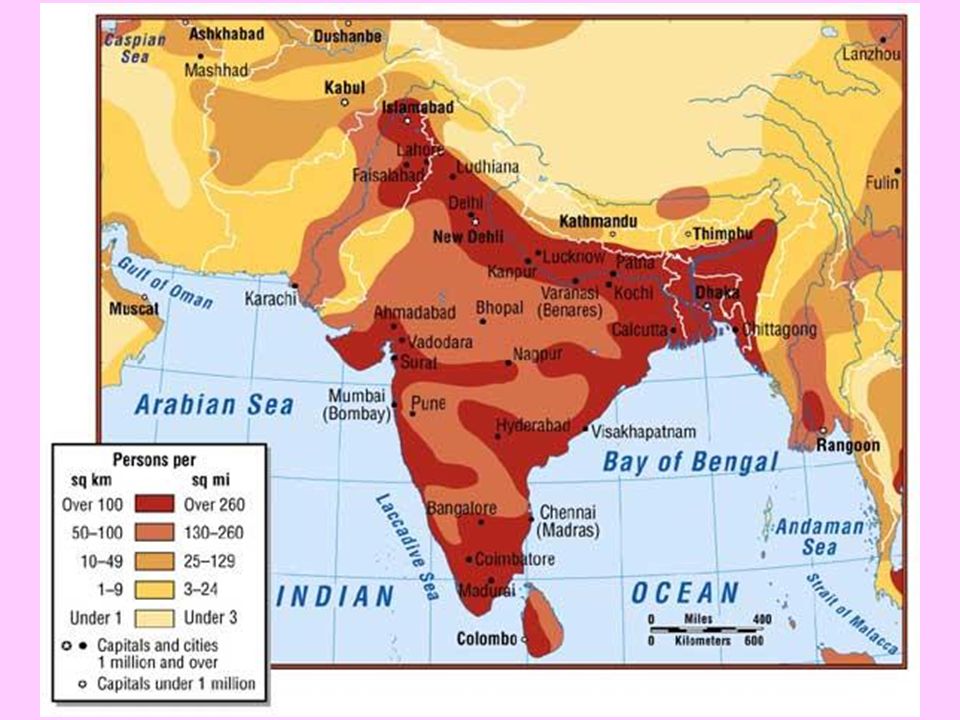
e. South Asia 1) 1/5 of the world’s population 2) India is the 2 nd most populous country (1.22 billion) 3) India, Bangladesh (8 th ), and Pakistan (6 th ) populations clustered in Indus and Ganges river valleys 4) 75% live in poor rural areas
 1/5 of the world’s population 2) India is the 2 nd most populous country (1.22 billion) 3) India, Bangladesh (8 th ), and Pakistan (6 th ) populations clustered in Indus and Ganges river valleys 4) 75% live in poor rural areas.")
42
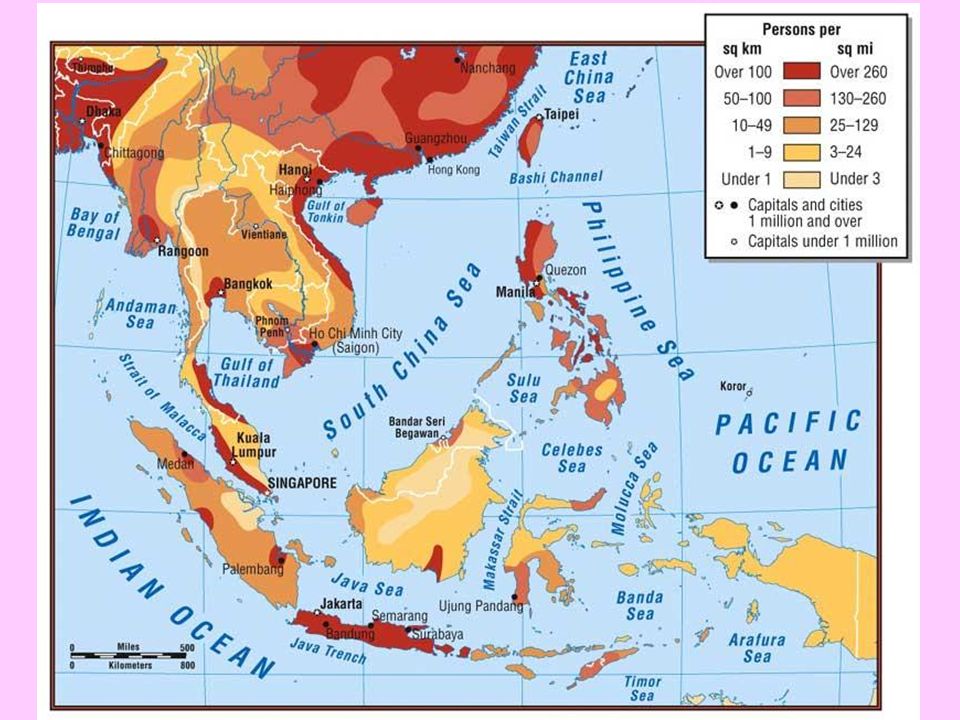
f. Southeast Asia 1) Population scattered across mainland and islands 2) Indonesia is the 4 th most populous country (251 million) and Vietnam is one of the fastest growing countries in the world 3) Most live in rural areas as either fishermen or rice farmers
 Population scattered across mainland and islands 2) Indonesia is the 4 th most populous country (251 million) and Vietnam is one of the fastest growing countries in the world 3) Most live in rural areas as either fishermen or rice farmers.")
44
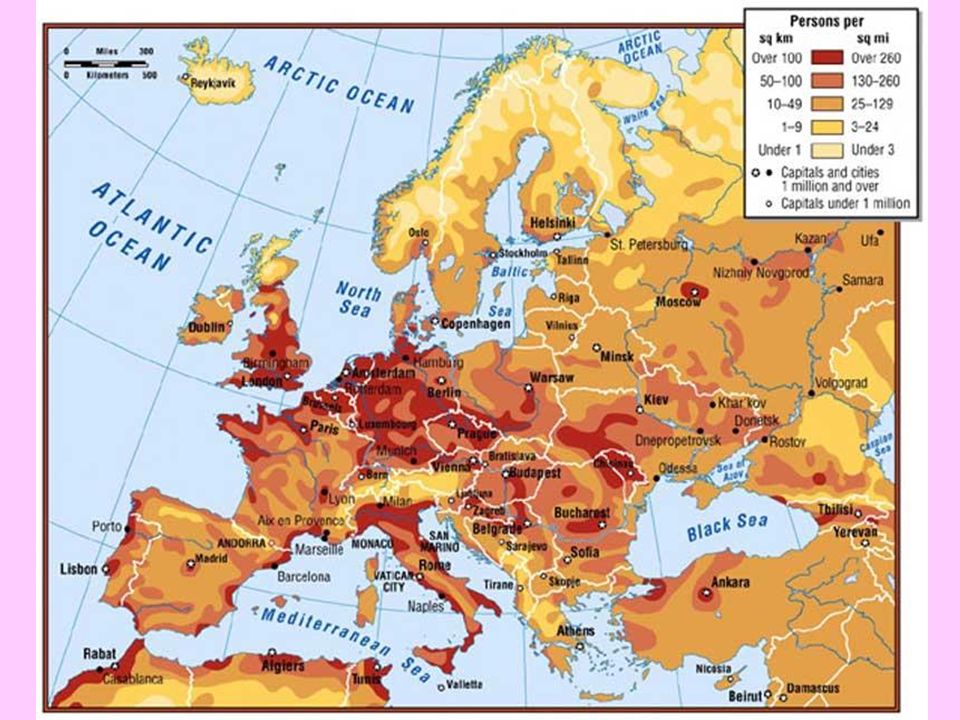
g. Europe 1) 1/9 of the world’s population (EU = 504 million) 2) 75% live in urban areas clustered in England, Germany, and Belgium 3) Europe is the first region in history to experience a long-term population decline
 1/9 of the world’s population (EU = 504 million) 2) 75% live in urban areas clustered in England, Germany, and Belgium 3) Europe is the first region in history to experience a long-term population decline.")
46
Case Study: Russia –Population projected to drop from 140M => 104M by 2050 –Russia’s TFR = 1.5 (one of the lowest in the world) –Putin has called for the birthrate to grow by at least 25% by 2015
 –Putin has called for the birthrate to grow by at least 25% by 2015")
47
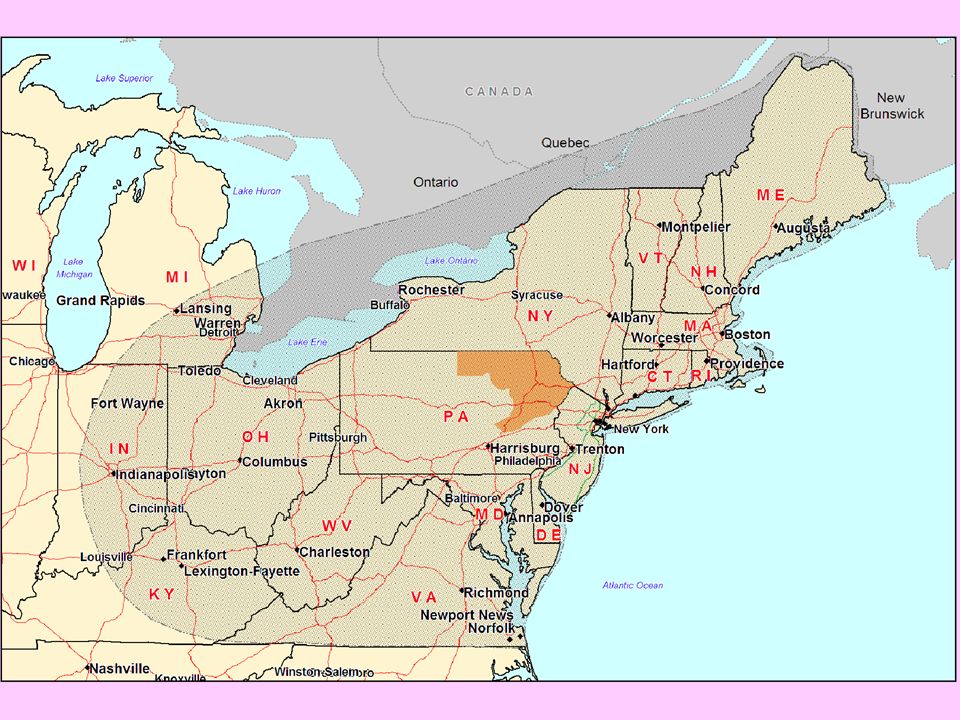
h. NE United States/SE Canada 1) Almost 50% of North America’s population located in this region 2) US is the 3 rd most populous country (317 million)
 Almost 50% of North America’s population located in this region 2) US is the 3 rd most populous country (317 million).")
49
SUSTAINABILITY

50
a. Carrying capacity: The number of people a given area can support

51
b. Homeostatic plateau: Population = carrying capacity of an area

52
c. Overpopulation Not based on number of people, but on availability of resources in a given area

53
d. Underpopulation Population is less than what the resources of the area can support

Similar presentations


 Illustrate the Demographic Divide in 2008. Source:>")


>")


 Total Fertility Rate (TFR) Crude Death Rate (CDR) Infant Mortality.>")


