Download presentation
Presentation is loading. Please wait.

1
Psychiatric epidemiology Nicole Vogelzangs Department of Psychiatry / EMGO+ Institute VU University Medical Center GGZ inGeest

2
Topics Classification en diagnostics Prevalence of psychiatric disorders Etiology of depression Public mental health NESDA: a psychiatric epidemiological study Interaction mental health with somatic disease

3
Topics Classification en diagnostics Prevalence of psychiatric disorders Etiology of depression Public mental health NESDA: a psychiatric epidemiological study Interaction mental health with somatic disease

4
Psychiatric disorder Condition characterized by disturbed mental functioning causing distress and/or impaired social functioning Mental functioning: becoming aware of information from the environment, appreciating this information, weighing and testing this by previous experiences, leading to automatic muscle movements and acting on the environment

5
Psychiatric disorder Most psychiatric disorders: Pathologic-anatomical of pathophysiological disease process unknown Diagnosis is based on pattern of complaints and symptoms Emphasis on diagnosing based on subjective disease perception, social dysfunctioning and need for care

6
Classification and Diagnostics <1968: Categories and dimensions without clear definition; different “schools” 1968: ICD-8 - Categories with glossary 1980: DSM-III - Categories with explicit inclusion- and exclusion criteria (currently DSM-IV) 1980: Semi-structured and fully structured interviews – for example CIDI psychiatric interview
 1980: Semi-structured and fully structured interviews – for example CIDI psychiatric interview")
7
Diagnosing is counting symptoms!

8
1Depressed mood 2Lack of interest 3Sleep disorders 4Appetite/weight changes 5Low energy 6 Concentration problems 7 Retardation or agitation 8Guilt or worthlessness 9Suicidal ideation Panic disorder Specific phobia Social phobia Generalized anxiety disorder Obsessive compulsive disorder Depression Anxiety disorder

9
Major Depressive Disorder ≥ 5 of the 9 key DSM depression criteria present for at least 2 weeks, most of the day limiting daily functioning Dysthymia depressed mood, not always as severe present very chronic: > 2 years Subthreshold depression (minor depression) different definitions: DSM-criteria or screening questionnaire (CES-D, BDI, IDS) prevalence depending on definition Depressive Disorders
 different definitions: DSM-criteria or screening questionnaire (CES-D, BDI, IDS) prevalence depending on definition Depressive Disorders")
10
Depression = container concept melancholie geen energie atypische depressie nerveus manisch Melancholy No energy Nervous Manic Atypical depression

11
Panic disorder Attacks of recurrent, severe fear with ‘somatic’ symptoms, e.g. sweating, shortness of breath, trembling, palpitations, fear of going crazy Often accompanied with agoraphobia: avoidance behavior Anxiety Disorders Specific phobia Fear for 1 situation, thing or animal (e.g. spiders, flying, water) Limits daily functioning
 Limits daily functioning.")
12
Social phobia Fear for social circumstances (e.g. speaking in public) Generalized Anxiety Disorder (GAD) Nervousness / worrying much more than usual Without clear reasons Rather large overlap with depression Obsessive Compulsive Disorder (OCD) Compulsions and/or obsessions that cause stress Anxiety Disorders
 Generalized Anxiety Disorder (GAD) Nervousness / worrying much more than usual Without clear reasons Rather large overlap with depression Obsessive Compulsive Disorder (OCD) Compulsions and/or obsessions that cause stress Anxiety Disorders.")
13
Measuring in a research setting? Psychiatric interview - symptom questionnaire Self-report - observation Problems Overlap between normal and pathology Overlap between disorders Heterogeneity within disorders Little specificity (biological) markers
 markers.")
14
Psychiatric epidemiology Normal and special Normal: Population description / case definition / risk factors / analysis techniques Special: Stigmatizing character disease / illegal drugs Case definitions more ambiguous Reduced response rates in research Reduced therapy adherence in clinical trials High drop-out High placebo-response in RCTs Self selection & motivation important for treatment effects

15
Topics Classification en diagnostics Prevalence of psychiatric disorders Etiology of depression Public mental health NESDA: a psychiatric epidemiological study Interaction mental health with somatic disease

16
The ‘soul’ in numbers: world wide in 2001 Depression 121 million Alcohol use disorder 70 million Alzheimer’s disease 37 million Schizophrenia 24 million =>Lifetime psychiatric disorder: 25% of world population World Health Report, WHO 2001

17
Prevalence of psychiatric disorders per year Netherlands (NEMESIS study, n > 7000) depression anxiety alcohol drug schizo- eating dependence depend. phrenia disorder Bijl et al. Soc Psychiatry Psychiatr Epidemiol 1998 % 2 6 4

18
Lifetime prevalence across gender (NEMESIS)
")
19
Country% psych. disorder % depres. disorder Country% psych. disorder % depres. disorder Belgium12.06.2Libanon16.96.6 France18.48.5Nigeria4.70.8 Germany9.13.6Japan8.83.1 Italy8.23.8Beijing9.12.5 Netherlands14.96.9Shanghai4.31.7 Spain9.24.9Colombia17.86.8 Ukraine20.59.1Mexico12.24.8 USA26.49.6 Depressive disorder in last year in 15 countries Demytteenaere K et al. JAMA 2004;291:2581-2590

20
WHO 2001 “psychiatric illnesses are not present in selected areas or groups: they are everywhere!”

21
Life time prev. 1-year prev. Prevalence of depression in the Netherlands (NEMESIS study: 18-64 years) men women Bijl et al. Soc Psychiatry Psychiatr Epidemiol 1998 major depression dysthymia %
 men women Bijl et al. Soc Psychiatry Psychiatr Epidemiol 1998 major depression dysthymia %.")
22
Major depression by age and sex % * * * * p<.05 Results from the Longitudinal Aging Study Amsterdam

23
Subthreshold depressive symptoms by age and sex % * * * p<.05 Results from the Longitudinal Aging Study Amsterdam *

24
Life-time 1-year Prevalence of anxiety in the Netherlands (NEMESIS study: 18-64 years) m w m w Bijl et al. Soc Psychiatry Psychiatr Epidemiol 1998 panic specific social disorder phobia phobia GAD %

25
Comorbidity of depression & anxiety disorders n=2981 Comorbid anxiety Comorbid depression Comorbid total Current* depressive disorder 59%23%63% Current* anxiety disorder 31%59%65% * last 6 months

26
Mechanisms to comorbidity 1.Disorder 1 and 2 occur together coincidentally 2.Disorder 1 and 2 are part of a third underlying disorder 3.Disorder 1 and 2 have overlapping diagnostic items 4.Disorder 1 predisposes or causes disorder 2 5.Disorder 2 predisposes or causes disorder 1 6.Disorder 1 and 2 are the result of a causal of predisposing factor 3

27
1992 2003 % Kessler et al. JAMA 2003; NEJM 2005 Prevalence of depression across time (NCS en NCS-R studies, n>18,000)
.")
28
36-50% of serious cases in developed countries and 76-85% of serious cases in less-developed countries DO NOT RECEIVE TREATMENT Demyttenaere K et al. JAMA 2004;291:2581-2590

29
Filter model of Goldberg & Huxley Depression in general population (1-MP: N=250.000) Depression in general practice (search for care) (1-MP: 80% N=200.000) Recognition depression by GP (recognition) (1-MP: 50-70% 120.000) Referral to ambulant GGZ (referral) (1-MP: 7-9% 8.500) Intramural GGZ (referral) (1-MP: 1% 1.000)
 Depression in general practice (search for care) (1-MP: 80% N= ) Recognition depression by GP (recognition) (1-MP: 50-70% ) Referral to ambulant GGZ (referral) (1-MP: 7-9% 8.500) Intramural GGZ (referral) (1-MP: 1% 1.000)")
30
Topics Classification en diagnostics Prevalence of psychiatric disorders Etiology of depression Public mental health NESDA: a psychiatric epidemiological study Interaction mental health with somatic disease

31
depression & anxiety: complex diseases

32
….depression manifests in many ways….

33
Depression is a complex disorder: many interacting contributing mechanisms Identified contributing factors include stressors as well as vulnerabilities: - Genetic factors - Somatic health factors - Psychosocial factors - Behavioral factors

34
Vulnerability - Stress Model Grouping of most mentioned etiological factors VulnerabilityStressors Environment lack of social support deprivation Personal vulnerability genetic load vulnerable personality childhood experiences previous depression Recent life events / loss (lasting) conflicts adverse conditions Physical unhealthiness diseases medication disability or handicap Depression adapted from Brown & Harris, 1978; Beekman & Ormel, 1999
 conflicts adverse conditions Physical unhealthiness diseases medication disability or handicap Depression adapted from Brown & Harris, 1978; Beekman & Ormel, 1999")
35
Overview of genome wide linkage studies Genetic factors Twin studies: heritability = 30 – 40%

36
Somatic health risk factors for depression - Heart disease / diabetes / stroke - Pain / migraine / arthritis - Physical disability / frailty - Vision and hearing impairment - Cognitive impairment - Inflammation, low sex steroid hormones (in aging)
")
37
Psychosocial risk factors for depression Psychological - Personality (esp. neuroticism) - Locus of control / mastery - Cognitive vulnerability (rumination, irritability, etc) Social - Childhood trauma and life events - Social network and support - Work (circumstances)
 - Locus of control / mastery - Cognitive vulnerability (rumination, irritability, etc) Social - Childhood trauma and life events - Social network and support - Work (circumstances).")
38
Behavioral factors associated with depression Smoking Depressed persons: smoke more often + less likely to quit inhale more + smoke more of cigarette NHANES: Anda et al. JAMA 1990 Alcohol use Depressed persons are more often excessive drinkers. Reversed causality is likely: - Alcohol use causes depression – ‘consequence theory’ - Depression causes alcohol use - ‘medicating theory’ - Third factors underlie both

39
Behavioral factors associated with depression Physical activity Depressed persons are more sedentary Physical exercise interventions improve mood Nutrition Vitamin B12 + folate deficiency may increase depression Metabolic syndrome (e.g. cholesterol) & obesity may increase depression N-3 fatty acids some – not consistent - evidence
 & obesity may increase depression N-3 fatty acids some – not consistent - evidence.")
40
Topics Classification en diagnostics Prevalence of psychiatric disorders Etiology of depression Public mental health NESDA: a psychiatric epidemiological study Interaction mental health with somatic disease

41
Rank 2030Disease% DALYs 1Depression9.6% 2Heart disease5.9% 3Alzheimer, dementia5.8% 4Alcohol problems4.7% 5Diabetes4.5% 6Stroke4.5% 7Hearing loss4.1% 8Cancer3.0% 9Arthritis2.9% 10Lung disease2.5% Worldwide disease burden* * in disability-adjusted life years (DALYs)= lost life years + loss of quality of life, Western countries WHO : Mathers; Plos Medicine 2006
= lost life years + loss of quality of life, Western countries WHO : Mathers; Plos Medicine 2006")
42
‘Dutch’ top ten diseases with largest disease burden 1Coronary heart disease 2Anxiety disorders 3Stroke 4Depression 5COPD 6Diabetes Mellitus 7Lung cancer 8Alcohol dependency 9Arthritis 10Dementia Assessed in healthy life expectancy Source: RIVM, Nationaal Kompas Volksgezondheid

43
Why high disease burden of depression? High prevalence Chronic disease: high relapse rate and chronicity Episodes cause substantial loss of quality of life Onset at relatively young age – on average between 25-30 years of age

44
Course of depression is very variable disease time sub-clinical normal symptoms

45
Course of depression Various studies: After 1-3 years: 50% still depressed “ Single episodes are extremely rare if the period of observation is significantly extended “ Angst et al. Psychiatr Neurol Neurochir 1973

46
Costs of depression €132 million per million adults About the same costs in minor depression About twice as much in dysthymia Total costs about € 600 million per million adults Smit et al. Journal of Mental Health Policy and Economics, 2006 Cuijpers et al. Acta Psychiatrica Scandinavica, 2007

47
So why is prevention necessary? Because of high –Prevalence –Incidence –Costs –Burden of disease Limited possibilities of treatment But: Prevention how and for whom?

48
Epidemiology of depression in The Netherlands Influx 357.000 Prevalence 738.000 recovery Mortality relapse Prevention Cure

49
Natural course of disorders Healthy universal prevention Risk group selective prevention Prodromal indicated prevention Disease treatment Chronicity: disability & handicap Remission

50
Topics Classification en diagnostics Prevalence of psychiatric disorders Etiology of depression Public mental health NESDA: a psychiatric epidemiological study Interaction mental health with somatic disease

51
Netherlands Study of Depression and Anxiety www.nesda.nl Funded through the mental health program of the Netherlands Organization of Health Research (ZonMW) and matching funds from participating institutes
 and matching funds from participating institutes")
52
Four central goals of NESDA 1.Describing course and consequences 2.Predicting course (demographic, psychosocial, somatic, biological and genetic determinants) 3.Role of stress regulating mechanisms and brain structures on course 4.Quality of care and perceived need for care
 3.Role of stress regulating mechanisms and brain structures on course 4.Quality of care and perceived need for care")
53
Key factors relevant for NESDA design 1.Depression AND anxiety (high comorbidity) 2.Different ‘settings’ 3.Long term course 4.Integrating psychosocial, clinical, genetic and (neuro)biological research paradigms
 2.Different ‘settings’ 3.Long term course 4.Integrating psychosocial, clinical, genetic and (neuro)biological research paradigms")
54
Naturalistic cohort study Baseline assessment and after 1, 2, 4, 6, 8 years Depression: - Major depression - Dysthymia - Minor depression Anxiety: - Generalized anxiety disorder - Social phobia - Panic disorder NESDA design

55
Persons with depression/anxiety from the general population (NEMESIS) Adults with parents with depression/anxiety (ARIADNE) Primary care: 3-step screening in 65 general practices –depression/anxiety patients –‘healthy’ controls Depression/anxiety patients from secondary care New cases at 17 GGZ locations with (primary) anxiety and/or depression NESDA design
 Adults with parents with depression/anxiety (ARIADNE) Primary care: 3-step screening in 65 general practices –depression/anxiety patients –‘healthy’ controls Depression/anxiety patients from secondary care New cases at 17 GGZ locations with (primary) anxiety and/or depression NESDA design")
56
2981 persons 1979 women (66%), 1002 men (34%) 18-65 year, mean age = 41.9 ± 13.0 year Mean education = 12.1 ± 3.3 year 97% has Dutch nationality 92% born in the Nederlands NESDA population
, 1002 men (34%) year, mean age = 41.9 ± 13.0 year Mean education = 12.1 ± 3.3 year 97% has Dutch nationality 92% born in the Nederlands NESDA population")
57
Total N No. with current Depr/Anx No. with lifetime Depr/Anx General population: - lifetime depression / Anxiety - parents with depression / Anxiety 303 261 104 47 303 123 Primary care: - controls: no symptoms/disorder - subthreshold symptoms - lifetime depression / Anxiety - current depression / Anxiety 373 141 353 743 0 743 0 353 743 Secondary care: - current depression / Anxiety 807 Total298117012329 * Current = in the last 6 months

58
NESDA baseline measurement At home: questionnaire 1 (a.o. severity, functioning, lifestyle) Informed consent Blood draw Breakfast Interview part 1 (demography, CIDI-diagnoses) Medical interview (a.o. blood pressure, heart rate, muscle strength) Interview part 2 (a.o. diseases, functioning, use of care) Psychological computer task Interview part 3 (mental history) At clinic or at home: questionnaire 2 (psychological characteristics) At home: salivary swaps for cortisol 3.5 - 4 hours
 Informed consent Blood draw Breakfast Interview part 1 (demography, CIDI-diagnoses) Medical interview (a.o. blood pressure, heart rate, muscle strength) Interview part 2 (a.o. diseases, functioning, use of care) Psychological computer task Interview part 3 (mental history) At clinic or at home: questionnaire 2 (psychological characteristics) At home: salivary swaps for cortisol hours.")
59
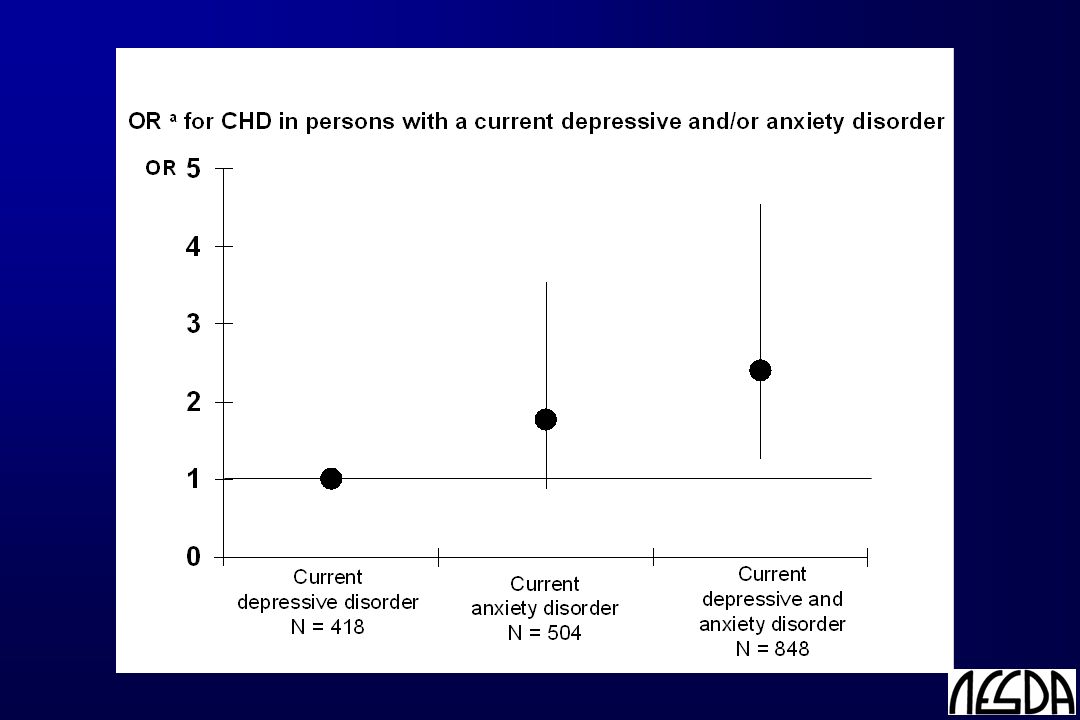
OR*95%CI No MDD or anxiety Remitted MDD or anxiety1.650.79-3.43 Current MDD1.410.61-3.23 Current anxiety2.701.31-5.56 Current MDD and anxiety3.541.79-6.98 * Adjusted for age, sex, education and lifestyle Coronary heart disease Example of use of NESDA data

61
See www.NESDA.nl for more study info and results

62
Topics Classification en diagnostics Prevalence of psychiatric disorders Etiology of depression Public mental health NESDA: a psychiatric epidemiological study Interaction mental health with somatic disease

63
Somatic consequences of depression Evidence from systematic reviews ReviewNo. of studiesEvidence MortalityWulsin 1999 Cuijpers 2002 n=21 n=25 +, RR=1.9 +, RR=1.8 Heart diseaseRugulies 2002 Wulsin 2003 Nicholson 2006 Van der Kooy 2007 n=11 n=10 n=21 n=28+, RR=1.6 +, RR=1.8 +, RR=1.6 DiabetesKnol 2006n=9+, RR=1.4 Stroke-n=7+ Hypertension-n=7+/- Cancer-n=4-, -/+

64
Possible explanations Life style Diminished self care First signs of disease (‘reverse causality’) Pathophysiological
 Pathophysiological")
65
Depression Cardiovascular disease Metabolic disturbances & obesity atherosclerosis HPA-axis Autonomic nervous system Sex steroid hormones Inflammation

66
Depression Cardiovascular disease Metabolic disturbances & obesity atherosclerosis HPA-axis Autonomic nervous system Sex steroid hormones Inflammation

67
Obesity and depression Cross-sectional studies show that (abdominal) obesity and depression are associated, but … Abdominal obesity Depression ? ?

68
“Longitudinal associations between Abdominal Obesity and Depression” Health, Aging, and Body Composition (ABC) Study Prospective cohort study in general population 3075 well-functioning black (41%) and white (59%) older persons, 70-79 years old Random sample of residents from Pittsburgh, Pennsylvania and Memphis, Tennessee Methods Design
 Study Prospective cohort study in general population 3075 well-functioning black (41%) and white (59%) older persons, years old Random sample of residents from Pittsburgh, Pennsylvania and Memphis, Tennessee Methods Design")
69
CES-D (CES-D-20 and CES-D-10) Depression on baseline: CES-D-20 ≥ 16 => 4.0% Depression onset: CES-D-10 ≥ 10 or new antidepressant use on any of the annual follow-up assessments in persons without baseline depression/antidepressant use - Mean follow-up: 4.3 ± 1.0 years - Onset in 23.7% “Longitudinal associations between Abdominal Obesity and Depression” Methods Depression
 Depression on baseline: CES-D-20 ≥ 16 => 4.0% Depression onset: CES-D-10 ≥ 10 or new antidepressant use on any of the annual follow-up assessments in persons without baseline depression/antidepressant use - Mean follow-up: 4.3 ± 1.0 years - Onset in 23.7% Longitudinal associations between Abdominal Obesity and Depression Methods Depression")
70
Baseline and 5-year follow-up Overall obesity: - Body Mass Index: weight / height 2 (kg/m 2 ) - % body fat (dual X-ray absorptiometry scan) Abdominal obesity: - Waist circumference (cm) - Sagittal diameter (cm) - Visceral fat (CT scan at L4-L5 level; cm 2 ) “Longitudinal associations between Abdominal Obesity and Depression” Methoden Obesity
 - % body fat (dual X-ray absorptiometry scan) Abdominal obesity: - Waist circumference (cm) - Sagittal diameter (cm) - Visceral fat (CT scan at L4-L5 level; cm 2 ) Longitudinal associations between Abdominal Obesity and Depression Methoden Obesity")
71
Statistical analyses 1.Cox regression: N=2540 [excl baseline depression] Covariates: Sociodemographic: age, sex, race, site, education Lifestyle: smoking, alcohol use, physical activity Disease: cardiovascular disease, diabetes Overall obesity: BMI baseline obesitydepression onset 2.Linear regression: N=2088 [obesity at follow-up] baseline depression 5-year change in obesity
![Statistical analyses 1.Cox regression: N=2540 [excl baseline depression] Covariates: Sociodemographic: age, sex, race, site, education Lifestyle: smoking, alcohol use, physical activity Disease: cardiovascular disease, diabetes Overall obesity: BMI baseline obesitydepression onset 2.Linear regression: N=2088 [obesity at follow-up] baseline depression 5-year change in obesity](http://images.slideplayer.com/36/10649583/slides/slide_71.jpg "Statistical analyses 1.Cox regression: N=2540 [excl baseline depression] Covariates: Sociodemographic: age, sex, race, site, education Lifestyle: smoking, alcohol use, physical activity Disease: cardiovascular disease, diabetes Overall obesity: BMI baseline obesitydepression onset 2.Linear regression: N=2088 [obesity at follow-up] baseline depression 5-year change in obesity")
72
Sample characteristics % or mean (SD)MenWomen Age (years)73.7 (2.8)73.5 (2.9) Black35.544.7 Baseline depression3.44.5 Depression onset rate / 1000 PY45.963.5 BMI (kg/m 2 )27.1 (3.8)27.7 (5.4) % body fat29.4 (4.9)40.7 (5.7) Waist circumference (cm)101.1 (10.6)98.2 (13.4) Sagittal diameter (cm)23.7 (3.3)23.4 (3.4) Visceral fat (cm 2 )156.0 (71.6)131.9 (60.3) Change in BMI (kg/m 2 )-0.1 (1.6)0.0 (2.0) Change in % body fat0.8 (2.6)*-0.1 (2.8) Change in waist circumference (cm)0.6 (6.1)*-2.0 (11.5)* Change in sagittal diameter (cm)0.4 (2.2)*0.1 (2.0) Change in visceral fat (cm 2 )-1.0 (46.1)-11.4 (34.6)*
MenWomen Age (years)73.7 (2.8)73.5 (2.9) Black Baseline depression Depression onset rate / 1000 PY BMI (kg/m 2 )27.1 (3.8)27.7 (5.4) % body fat29.4 (4.9)40.7 (5.7) Waist circumference (cm)101.1 (10.6)98.2 (13.4) Sagittal diameter (cm)23.7 (3.3)23.4 (3.4) Visceral fat (cm 2 )156.0 (71.6)131.9 (60.3) Change in BMI (kg/m 2 )-0.1 (1.6)0.0 (2.0) Change in % body fat0.8 (2.6)*-0.1 (2.8) Change in waist circumference (cm)0.6 (6.1)*-2.0 (11.5)* Change in sagittal diameter (cm)0.4 (2.2)*0.1 (2.0) Change in visceral fat (cm 2 )-1.0 (46.1)-11.4 (34.6)*")
73
baseline obesitydepression onset Vogelzangs et al. J Clin Psychiatry 2009

74
Risk of depression onset N=2540 MEN * N=1233 HR a 95%CIP Overall obesity BMI 1.171.00-1.37.05 % body fat 1.171.01-1.34.04 Abdominal obesity Waist circumference 1.191.03-1.39.02 Sagittal diameter 1.201.05-1.37.007 Visceral fat 1.171.04-1.31.009 a Adjusted for sociodemographics, life-style and diseases; * P sex-interactions:.05-.11; no race interactions WOMEN * N=1307 HR a 95%CIP 0.99 0.91-1.09.87 0.98 0.89-1.08.65 1.010.92-1.11.82 1.040.93-1.15.53 1.010.90-1.13.84

75
Risk of depression onset MEN N=1233HR a 95%CIP - SIMULTANEOUSLY ENTERED - BMI 1.100.92-1.31.29 Visceral fat 1.171.03-1.33.01 a Adjusted for sociodemographics, life-style and diseases

76
Normal visceral fat 4.2% / year Ref High visceral fat 5.5% / year HR=1.33 (1.00-1.77), p=.05 Men Onset rate a Adjusted Hazard ratio b Normal visceral fat 6.2% / year Ref High visceral fat 6.9% / year HR=1.04 (0.82-1.32), p=.75 Women Onset rate a Adjusted Hazard ratio b Years to onset of depressive symptoms 0 1 2 3 4 5 Cumulative onset of depressive symptoms 0.3 0.2 0.1 0.0 Cumulative onset of depression according to sex and visceral fat
, p=.05 Men Onset rate a Adjusted Hazard ratio b Normal visceral fat 6.2% / year Ref High visceral fat 6.9% / year HR=1.04 ( ), p=.75 Women Onset rate a Adjusted Hazard ratio b Years to onset of depressive symptoms Cumulative onset of depressive symptoms Cumulative onset of depression according to sex and visceral fat")
77
baseline depression 5-year change in obesity Vogelzangs et al. Arch Gen Psychiatry 2008

78
Depression and 5-year change in obesity N=2088CES-D ScoreCES-D ≥ 16 β aβ a Pβ aβ a P Overall obesity BMI.035.11.030.18 % body fat.007.76-.002.94 Abdominal obesity Waist circumference.026.15.031.08 Sagittal diameter.037.10.054.01 Visceral fat.042.08.080.001 a Adjusted for sociodemographics, life-style, diseases, and BMI (for abdominal obesity) Within women: race-interactions: P =.06-.09
 Within women: race-interactions: P =")
79
Adjusted mean 5-year change in visceral fat White men White women Black men Black women cm 2 No baseline depression Baseline depression p <.001p =.05p =.06p =.54 p overall =.001

80
In an older population, abdominal obesity is independently and more strongly associated with depression than overall obesity In older men, but not older women abdominal obesity predicts the onset of depression over 5 years In both men and women (except black women) depression predicts an increase in abdominal obesity fat over 5 years Conclusions
 depression predicts an increase in abdominal obesity fat over 5 years Conclusions")
81
Vicious cycle between depression and abdominal obesity Abdominal obesity Depression

Similar presentations


 http://www.youtube.com/watch?v=CnOJgDW0gPI#aid=P9W4M9Qh3VY.>")


