Download presentation
Presentation is loading. Please wait.

1
The Great Beyond 20/20® DLI Atlantic 2015 Siobhan Hanratty 29 April 2015

2
What is Beyond 20/20 Software that enables: – Data display from different perspectives – Extract data – Manipulate and Present data accordingly to needs Changing the Frequency of the Displayed Data Creating Percentage Distributions Performing Calculations Charting and Mapping Data – Saving in different formats

3
Beyond 20/20 Concepts Derived from the QuickStart Guide A table is an integrated presentation of multi-dimensional data and descriptive text. Tables are composed of descriptive components, dimension field information and data values. A dimension describes an attribute of the table data, such as Profile or Geography. Beyond 20/20 tables can have up to ten dimensions. An item is an element of a dimension; for example, Canada is an item of the Geography dimension, and Population, 2006 an item of the Profile dimension. A label is a title or display heading of an item.

4
Components and Basic Functionalities of a B20/20 Table Display a table Changing the Table and User Interface Language Table Browsing Selecting data, adjacent or non-adjacent Setting up data by switching and nesting* of table dimensions Save a table in B20/20 or any other format

5
What’s the Diff? Census table - HTMLCensus table – B2020

6
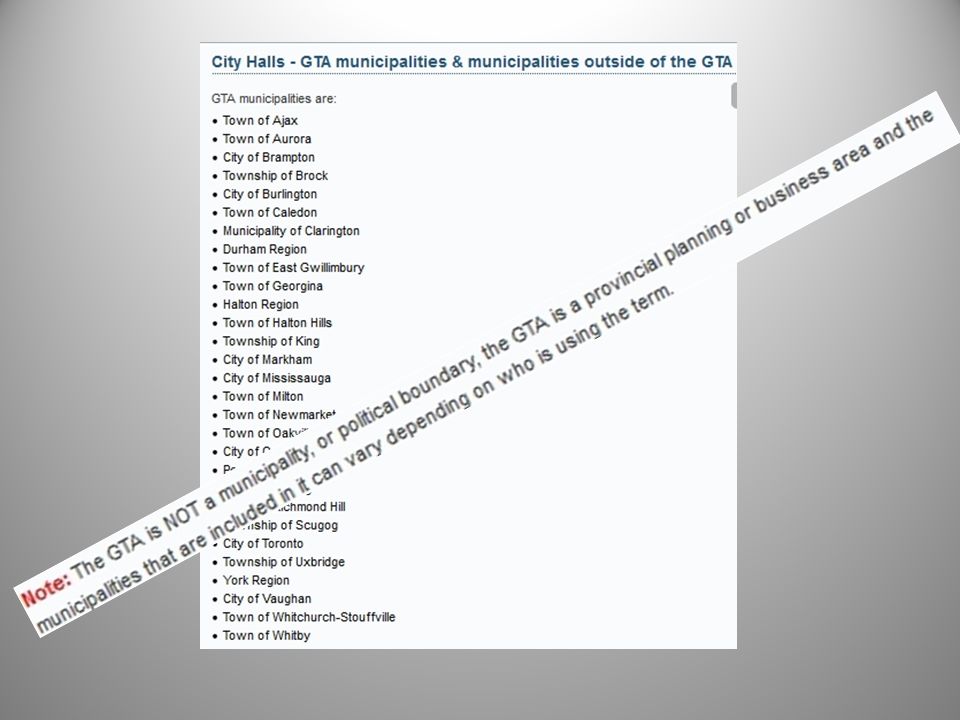
The GTA What are the municipalities of within the GTA What is the relationship between the GTA and Toronto CMA? Am I destined to scroll up and down a census table, or is there a short-cut I can use?

8
The CMA & CSDs

9
Use a Profile to Select Geography

10
CAUTION Make sure you have the correct dimension selected before you try to load your profile

11
Success

12
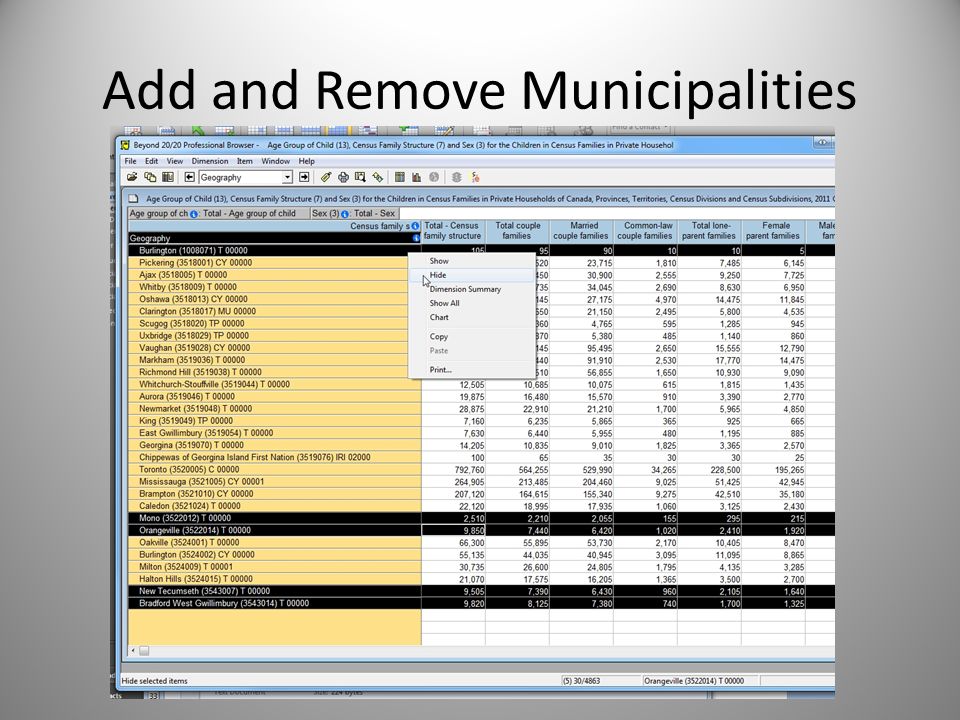
Add and Remove Municipalities

14
Create Desired Table Create a table showing the number of census families (by structure) by age group for all of the CSDs in the GTA with no sex breakdown
 by age group for all of the CSDs in the GTA with no sex breakdown")
15
Create Desired Table Create a table showing the number of census families (by structure) by age group for all of the CSDs in the GTA with no sex breakdown
 by age group for all of the CSDs in the GTA with no sex breakdown")
16
Define Groups

17
Success Again

18
Change Labels Age Group of Child

19
Change Labels Census Family Structure

20
Export file (dbf) for use in GIS Old Labels New Labels
 for use in GIS Old Labels New Labels")
Similar presentations


 732-7188 GIS and Mapping Procedures in ArcMap 9.x Creating an ArcMap Project Editing an ArcMap Project Printing an ArcMap Project.>")


