Download presentation
Presentation is loading. Please wait.

1
Variable-Frequency Response Analysis Network performance as function of frequency. Transfer function Sinusoidal Frequency Analysis Bode plots to display frequency response data VARIABLE-FREQUENCY NETWORK PERFORMANCE

2
VARIABLE FREQUENCY-RESPONSE ANALYSIS In AC steady state analysis the frequency is assumed constant (e.g., 60Hz). Here we consider the frequency as a variable and examine how the performance varies with the frequency. Variation in impedance of basic components Resistor

3
Inductor

4
Capacitor

5
Frequency dependent behavior of series RLC network

6
For all cases seen, and all cases to be studied, the impedance is of the form Simplified notation for basic components Moreover, if the circuit elements (L,R,C, dependent sources) are real then the expression for any voltage or current will also be a rational function in s
 are real then the expression for any voltage or current will also be a rational function in s")
7
NETWORK FUNCTIONS When voltages and currents are defined at different terminal pairs we define the ratios as Transfer Functions If voltage and current are defined at the same terminals we define Driving Point Impedance/Admittance Some nomenclature To compute the transfer functions one must solve the circuit. Any valid technique is acceptable EXAMPLE

8
We will use Thevenin’s theorem

9
POLES AND ZEROS (More nomenclature) Arbitrary network function Using the roots, every (monic) polynomial can be expressed as a product of first order terms The network function is uniquely determined by its poles and zeros and its value at some other value of s (to compute the gain) EXAMPLE
 Arbitrary network function Using the roots, every (monic) polynomial can be expressed as a product of first order terms The network function is uniquely determined by its poles and zeros and its value at some other value of s (to compute the gain) EXAMPLE")
10
SINUSOIDAL FREQUENCY ANALYSIS Circuit represented by network function

11
HISTORY OF THE DECIBEL Originated as a measure of relative (radio) power By extension Using log scales the frequency characteristics of network functions have simple asymptotic behavior. The asymptotes can be used as reasonable and efficient approximations

12
General form of a network function showing basic terms Frequency independent Poles/zeros at the origin First order terms Quadratic terms for complex conjugate poles/zeros Display each basic term separately and add the results to obtain final answer Let’s examine each basic term

13
Constant Term Poles/Zeros at the origin

14
Simple pole or zero Behavior in the neighborhood of the corner Asymptote for phase High freq. asymptote Low freq. Asym.

15
Simple zero Simple pole

16
Quadratic pole or zero Corner/break frequency Resonance frequency Magnitude for quadratic pole Phase for quadratic pole These graphs are inverted for a zero

17
LEARNING EXAMPLE Generate magnitude and phase plots Draw asymptotes for each term Draw composites

18
asymptotes

19
DETERMINING THE TRANSFER FUNCTION FROM THE BODE PLOT This is the inverse problem of determining frequency characteristics. We will use only the composite asymptotes plot of the magnitude to postulate a transfer function. The slopes will provide information on the order A A. different from 0dB. There is a constant Ko B B. Simple pole at 0.1 C C. Simple zero at 0.5 D D. Simple pole at 3 E E. Simple pole at 20 If the slope is -40dB we assume double real pole. Unless we are given more data

20
LEARNING EXAMPLE A function with complex conjugate poles Put in standard form Draw composite asymptote Behavior close to corner of conjugate pole/zero is too dependent on damping ratio. Computer evaluation is better

21
Evaluation of frequency response using MATLAB » num=[25,0]; %define numerator polynomial » den=conv([1,0.5],[1,4,100]) %use CONV for polynomial multiplication den = 1.0000 4.5000 102.0000 50.0000 » freqs(num,den) > pzmap(num,den) Using default options
![Evaluation of frequency response using MATLAB » num=[25,0]; %define numerator polynomial » den=conv([1,0.5],[1,4,100]) %use CONV for polynomial multiplication den = » freqs(num,den) > pzmap(num,den) Using default options](http://images.slideplayer.com/36/10642756/slides/slide_21.jpg "Evaluation of frequency response using MATLAB » num=[25,0]; %define numerator polynomial » den=conv([1,0.5],[1,4,100]) %use CONV for polynomial multiplication den = » freqs(num,den) > pzmap(num,den) Using default options")
22
Resonant Circuits The resonance phenomenon and its characterization Filter Networks Networks with frequency selective characteristics: low-pass, high-pass, band-pass VARIABLE-FREQUENCY NETWORK PERFORMANCE

23
RESONANT CIRCUITS These are circuits with very special frequency characteristics… And resonance is a very important physical phenomenon The frequency at which the circuit becomes purely resistive is called the resonance frequency

24
Properties of resonant circuits At resonance the impedance/admittance is minimal Current through the serial circuit/ voltage across the parallel circuit can become very large (if resistance is small) Given the similarities between series and parallel resonant circuits, we will focus on serial circuits
 Given the similarities between series and parallel resonant circuits, we will focus on serial circuits")
25
EXAMPLE Determine the resonant frequency, the voltage across each element at resonance and the value of the quality factor

26
Resonance for the series circuit

27
The Q factor dissipates Stores as E field Stores as M field Capacitor and inductor exchange stored energy. When one is at maximum the other is at zero

28
EXAMPLE The Tacoma Narrows Bridge Opened: July 1, 1940 Collapsed: Nov 7, 1940 Likely cause: wind varying at frequency similar to bridge natural frequency

29
FILTER NETWORKS Networks designed to have frequency selective behavior COMMON FILTERS Low-pass filter High-pass filter Band-pass filter Band-reject filter

30
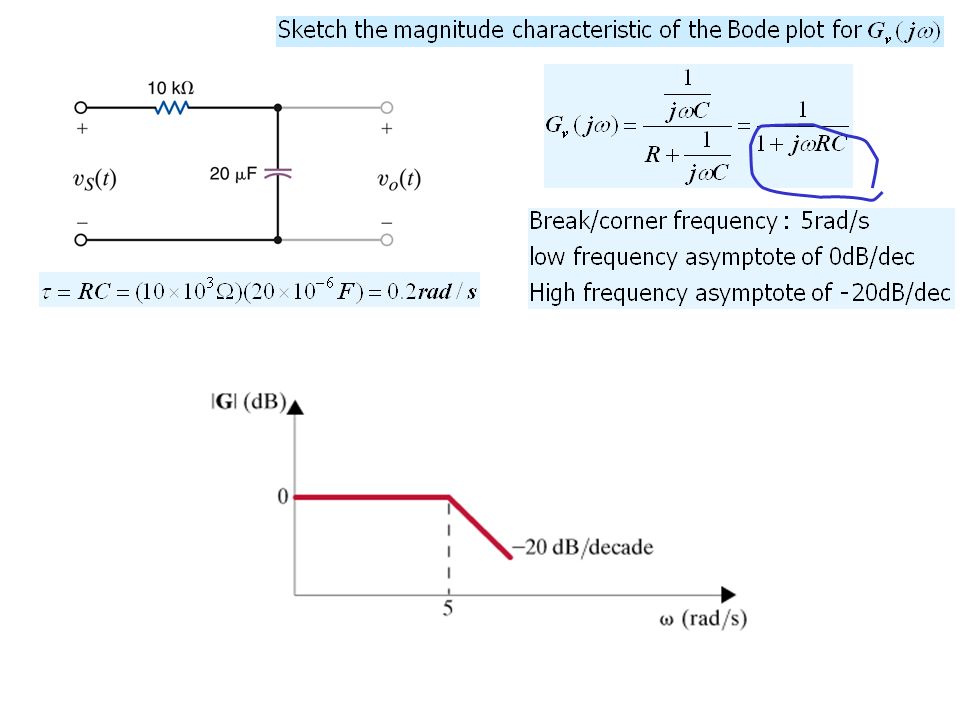
Simple low-pass filter

31
Simple high-pass filter

32
Simple band-pass filter Band-pass

33
Simple band-reject filter

Similar presentations