Download presentation
Presentation is loading. Please wait.

2
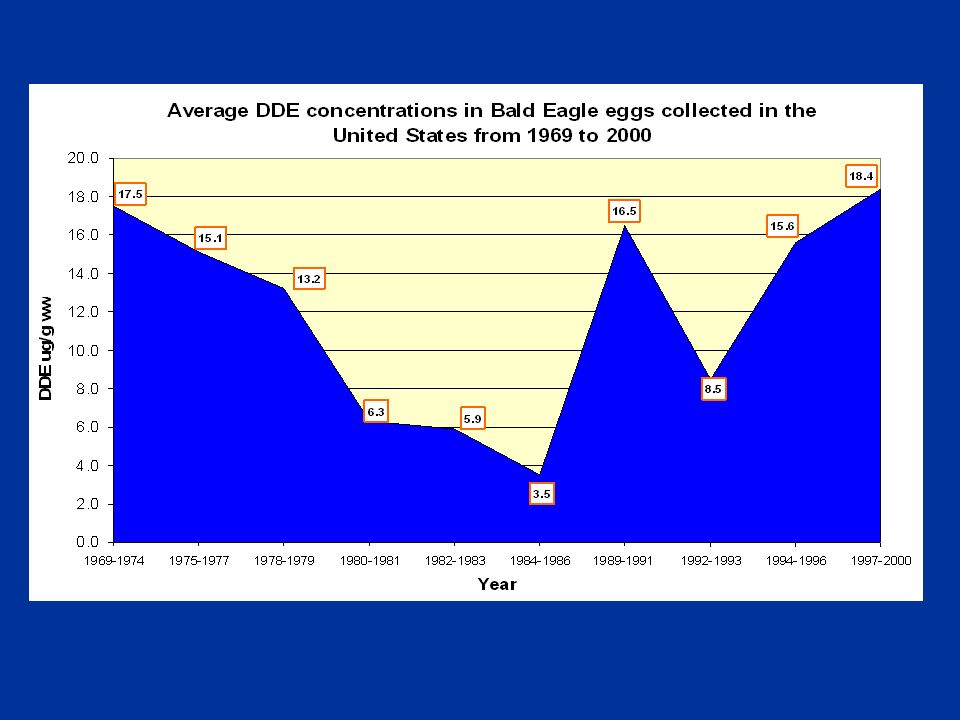
DDE (ug/g ww average concentration) in Bald Eagle eggs by Year
 in Bald Eagle eggs by Year")
4
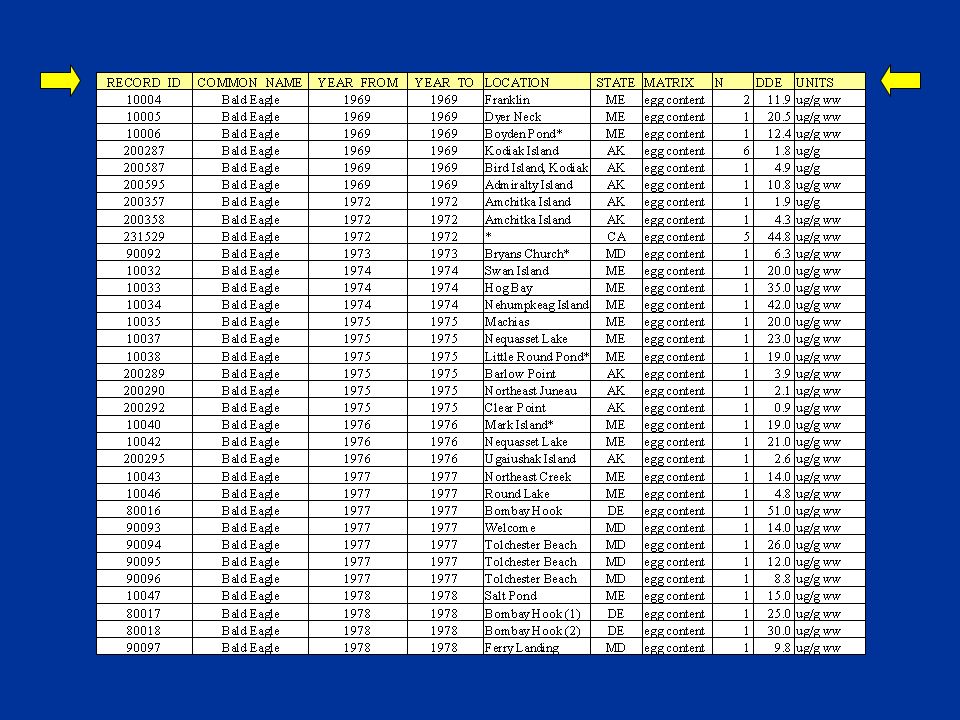
Discussion Questions: Bald Eagle Graph 1 1.Does your graph support your hypothesis? Why or why not? 2.Looking at your graph, was the DDT ban effective in reducing the concentration of DDE in bald eagle eggs? 3.Look at the value for N for each year group. Do different year groups have relatively similar values for N? How might differences in N between year groups affect the accuracy of the averages you calculated? 4.During what year groups does your bald eagle graph show a trend similar to that seen in the osprey graph? During what year groups does your bald eagle graph differ from the osprey graph? 5.Look carefully at the data records you used to make your graph. Refer to the worksheet, “baldeagle”, that contains the records you organized and from which you calculated your year group averages. What do you think might account for the difference in the osprey and bald eagle trends? Is there anything that stands out about the data collected after 1986? 6.Suggest a new hypothesis to explain the high DDE concentrations in bald eagle eggs after 1986.

Similar presentations


 What do you want to know or explain? Quantitative=measure Qualitative=describe.>")
 Explain the physical and human causes of climate change 6 Explain the effects of climate change 6 Explain the solutions adopted.>")


