Download presentation
Presentation is loading. Please wait.

1
The Service Environment The service system mainly serves to convert inputs into services. In service systems, services are provided with the addition of overhead and direct labor to the inputs. PERISHABLE Services are PERISHABLE, and therefore cannot be stored. Service level and the quality of service are important factors in determining the type, quantity, and capacity of the service facilities. The layout The layout of the facility is closely related with the type of the services provided. The unit costs of the services can be determined in order to provide a valid framework for decision-making and planning purposes.

2
Objectives of a Service System 1.Increase customer satisfaction 2.Operate with less money 3.Increase customer potential and gain profit 4.Increase market share

3
Designing Services Selecting a service focus –Like manufacturing processes, different services have strengths and weaknesses Key is to design a service process that meets the needs of targeted customers The key is designing the “service package”.

4
What is the performance objective? Restaurant kitchen Software help desk Office Superstore copy center Airline reservations Jet maintenance

5
Degree of Customer Contact Low Contact “off-line” Can locate for efficiency Can smooth out the workload Check clearing, mail sorting High Contact “on-line” Can locate for easy access Flexibility to respond to customers Harder to manage Hospitals, food service

6
Classifying Services “Front Room” versus “Back Room” Back room – what the customer does not see Managed for efficiency and Productivity Package sorting, car repair, blood test analysis, accounting department Front room – what the customer can see Managed for flexibility and customer service Customer lobbies, bank teller, receptionist

7
A Cubical Model of Services (Three Dimensions) Nature of the Service Package Primarily Physical Activities (Airline, trucking firm) Primarily Intangible Activities (Law firm, software developer) Degree of CustomizationLower Customization (Quick-change oil shop) Higher Customization (Full-service car repair shop) Degree of Customer Contact Lower Contact (Mail sorting) Higher Contact (Physical therapist) Service operations compete and position themselves in the marketplace based on the three dimensions: 1-Nature of service package, 2-degree of customization and 3-degree of custome contact
 Nature of the Service Package Primarily Physical Activities (Airline, trucking firm) Primarily Intangible Activities (Law firm, software developer) Degree of CustomizationLower Customization (Quick-change oil shop) Higher Customization (Full-service car repair shop) Degree of Customer Contact Lower Contact (Mail sorting) Higher Contact (Physical therapist) Service operations compete and position themselves in the marketplace based on the three dimensions: 1-Nature of service package, 2-degree of customization and 3-degree of custome contact")
8
Community Hospital Public Hospital

9
Birthing Center Public Hospital

10
Class Example Compare the following services and describe the service package. Many universities are beginning to offer Web- based courses in lieu of traditional classes. These courses often contain lecture notes, linkages to videos and other documents and online testing capabilities.How are Web-based courses positioned vis-a-vis large lecture classes?What are the managerial challenges and differences in service packages?

11
Operations Planning And Control The production/service planning and control activities within the firm mainly deal with: 1.Efficiently managing the flow of materials and/or information 2.Effectively utilizing people and equipment 3.Coordinating the internal activities with those of suppliers 4.Communicating with the customers to meet their requirements The production/service planning activities are indispensable for the firm. They contribute to the firm’s objectives by satisfying the production/service requirements with respect to cost, volume and quality.

12
The production system may be further divided into subsystems such as: 1.Production planning system 2.Material planning system 3.Management Information system 4.Human resource planning system 5.Procurement system 6.Manufacturing system 7.Marketing system

13
1) Production Planning System: What to produce? When to produce? Overtime or a new shift? How to minimize overall production cost? How much inventory to be carried/stored in the factory floor/warehouse

14
1)Production Planning System: INVENTORIES: Definition and classification INVENTORIES: Definition and classification Inventories in a classical production system may be divided into three categories. 1.Raw materials inventory 1.Raw materials inventory is the unprocessed materials and/or parts waiting for further operations. 2.Work-in-process inventory (WIP) is the partially finished parts on the production floor at various production stages. finished goods inventory 3.The finished goods inventory consists of finished goods waiting for shipment.
 is the partially finished parts on the production floor at various production stages. finished goods inventory 3.The finished goods inventory consists of finished goods waiting for shipment..")
15
The inventory on the production floor may result from factors such as: 1.Stocks accumulated against seasonal fluctuations, 2.Stocks caused by receiving in large quantities, 3.Stocks due to transport delays during the delivery, and 4.Stocks due to processing rate differences between successive production stages.

16
unavoidable future uncertainties Inventories are sometimes unavoidable and may be an effective weapon for future uncertainties. However, high inventory means higher invested capital, which may in turn decrease the profitability of the firm. Little or no stock, on the other hand, may lead to lost sales and/or back-ordering. Both of which are very costly.

17
2) Material Planning System: Determines the material requirements (components,parts,raw materials,assemblies,supplies) necessary to satisfy the operation plan. Determines what type of material will be made available and when? What type of parts will be made available and when? Part-tree construction :Takes inputs from technical drawings and yearly demand forecasts. Preparation of Bill of Material

18
Bill of Material (BOM): product structure It is sometimes called product structure. Product structure is a diagram that shows the sequence in which raw material, purchased parts, and subassemblies are manufactured and assembled to form the end item. BOM’s can be designed to reflect varying degrees of complexity, depending upon the company needs. Utilized as a basic engineering document, the minimal requirements for BOM information could include: Structure Level Part Number Revision Level Quantity required Unit of measure Description Make or buy indicator

19
Example: Lego 1

20
A Generic Product Structure Diagram: SA: Subassembly PP : Purchased part MP: Manufactured part RM: Raw material LEVEL 0 LEVEL 1 LEVEL 2 LEVEL 3

21
Example: Lego 2

22
Product Structure: Example PRODUCT A 1 week B (2) 2 weeks D(2) 1 week E(2) 2 weeks C(3) 1 week E(2) 2 weeks F(2) 3 weeks G(1) 2 weeks D(2) 1 week LEVEL 0 LEVEL 1 LEVEL 2 LEVEL 3 Explosion process The quantities at each level are the requirements for the lower level.
 2 weeks D(2) 1 week E(2) 2 weeks C(3) 1 week E(2) 2 weeks F(2) 3 weeks G(1) 2 weeks D(2) 1 week LEVEL 0 LEVEL 1 LEVEL 2 LEVEL 3 Explosion process The quantities at each level are the requirements for the lower level.")
23
Summarized BOM PartQty A1 B2 C3 D 4 E4 F2 G1 Product A Qty B 2 D 2 E 2 C 3 E 2 F 2 G 1 D 2 INDENTED BOM Summarized BOM

24
3) Procurement System: From which suppliers, should the parts be purchased? Which suppliers, will have long-term contracts and how many will have short-term contracts? At what shares of each supplier, does a healthy procurement strategy form? Should we search for new suppliers for the new designed parts and new raw materials? Material budget studiesMaterial budget studies. Cost reduction and process efficiency projectsCost reduction and process efficiency projects with supplier firms.

25
4) Manufacturing System: It covers the following activities: New production line investment studies. New production methods with higher technology. Production/assembly line balancing studies. Productivity studies. Work force planning.

26
5) Management Information Systems Is the application of information technology to support business activities and organizational operations. Functions include: –1) Generating reports for routine/non-routine purposes –2) Answer what-if questions asked by management. –3) Support decision making
 Generating reports for routine/non-routine purposes –2) Answer what-if questions asked by management. –3) Support decision making.")
27
6) Human resource planning system Effective human resource planning can help managers meet organizational goals and effectively understand the needs of employees in the organization.Effective human resource planning can help managers meet organizational goals and effectively understand the needs of employees in the organization. Human resource department deals with: 1)Job Analysis and Specifications 2)Employee recruitment (hiring/firing) 3)Employee education and training 4)Employee performance and recognition 5)Employee well-being and morale
Job Analysis and Specifications 2)Employee recruitment (hiring/firing) 3)Employee education and training 4)Employee performance and recognition 5)Employee well-being and morale.")
28
7) Marketing SYSTEM deals with Setting up distribution channels. Order handling. Demand forecasting. Creating demand for newly designed products and/or markets Increasing competing capability. Being able to respond quickly and decisively to changing market conditions. Establishing new market strategies for newly developed products.

29
The service system may be further divided into subsystems such as: 1.Forecasting 2.Aggregate Service Planning and Master Scheduling 3.Service Requirements Planning 4.New Service Development and process design 5.Service Scheduling and Control 6.Quality Control 7.Maintenance Planning 8.Management Information System Design 9.Project Management

30
Cost Concepts and Engineering Economics Cost Concepts All the systems aim to produce products or services At minimum cost With maximum profitability With the most effective usage of resources With given financial, capacity, labor, and machine constraints.

31
What Type of Costs: Costs can be classified in two groups: 1.Fixed costs: These costs do not change with the amount of production or service given. Land costs Building costs Etc.. 2.Variable costs: They change with the amount of production and service given. Labor costs Material costs Inventory costs Etc...

32
COST STRUCTURE Total Cost Variable Costs Fixed Costs Cost ($) Production/Service Volume
 Production/Service Volume")
33
Costs are further classified as: 1.Production costs 2.Inventory costs 3.Capacity change costs 4.Etc...

34
Production Costs: Expenses incurred by production. Includes both fixed and variable costs of production like 1.Materials 2.Direct Labor 3.Overtime 4.Subcontracting 5.Facility overhead Energy Heating Water Etc...

35
Inventory Costs: Cost of holding or carrying inventory ( storage, insurance, investment, pilferage, etc. ) including costs involved in placing an order or setting up the equipment to make the product. 1.Unit cost, 2.Inventory holding costs, 3.Ordering cost, and 4.Stockout (shortage) costs.
 including costs involved in placing an order or setting up the equipment to make the product. 1.Unit cost, 2.Inventory holding costs, 3.Ordering cost, and 4.Stockout (shortage) costs..")
36
Inventory Costs: 1. Unit cost: Purchasing price of a material / part / product or total labor, material and overhead cost for one unit of production. 2. Inventory holding cost (Storage costs + Carrying Cost): The total cost of tying-up capital to keep inventory, providing services and storage facilities, and undertaking possible risks. A carrying cost involves the opportunity cost for holding inventory a.Storage costs: A subset of inventory holding costs, including the cost of warehouse utilities, material handling personnel, equipment maintenance, building maintenance, and security personnel. b.Carrying Cost: Cost of carrying inventory (Usually, approximated as the opportunity cost of tying-up money in inventory) is the percent of the dollar value of inventory per unit of time.
: The total cost of tying-up capital to keep inventory, providing services and storage facilities, and undertaking possible risks. A carrying cost involves the opportunity cost for holding inventory a.Storage costs: A subset of inventory holding costs, including the cost of warehouse utilities, material handling personnel, equipment maintenance, building maintenance, and security personnel. b.Carrying Cost: Cost of carrying inventory (Usually, approximated as the opportunity cost of tying-up money in inventory) is the percent of the dollar value of inventory per unit of time..")
37
3. Ordering cost: It is a combined cost of transmitting the order, receiving the product and placing it into storage, inbound transportation, and processing the invoice. A manufacturer uses the cost of a production setup instead of an ordering cost. 4. Stockout (shortage) costs: The lost sale and/or backorder cost incurred as a result of a stockout. a.Lost sale cost: The marginal profit that is lost when a customer orders an item that is not immediately available in stock. b.Backorder cost: It is the time dependent component of the stockout costs, the value of which depends on the customer reactions to a stockout, the frequency of stockouts, and the availability of substitute products.
 costs: The lost sale and/or backorder cost incurred as a result of a stockout. a.Lost sale cost: The marginal profit that is lost when a customer orders an item that is not immediately available in stock. b.Backorder cost: It is the time dependent component of the stockout costs, the value of which depends on the customer reactions to a stockout, the frequency of stockouts, and the availability of substitute products..")
38
Capacity Change Costs: 1.Hiring cost 2.Training cost 3.Cost for lost capacity until a worker is recruited or fully trained

39
2.4.2 Engineering Economics Engineering economy, is the analysis of the economic consequences of engineering decisions Engineering economy, is the analysis of the economic consequences of engineering decisions. It has the following goals: 1.To develop an understanding of the theoretical and conceptual basis for financial project analysis. 2.To satisfy the practical needs of the engineer toward making informed financial decisions. 3.To incorporate all critical decision-making tools including the most contemporary, computer-oriented ones. In summary it compares 1.Profit and 2.Non-profit organizations decide on capital investments for tangible and intangible assets.

40
Advanced topics in ENGINEERING ECONOMY include: 1.After-tax analysis, 2.Replacement and retirement analysis, 3.Effects of inflation, 4.Capital budgeting techniques, 5.Sensitivity analysis, 6.Risk and uncertainty analysis, 7.Multi-attribute analysis

41
TOOLS USED IN ENGINEERING ECONOMY Balance Sheet: It is a statement of the financial value (or worth) of a business or an organisation at a particular date, usually, at the end of its “fiscal year". Income Statement: The financial statement that shows whether the business earned a profit by subtracting expenses from revenues. Breakeven analysis: A tool used to determine when a business will be able to cover all its expenses and begin to make a profit. Sensitivity analysis: Analysis of the effect on a project's profitability due to changes in sales, cost, etc...

42
Balance Sheet: It is a statement of the financial value (or worth) of a business or an organisation at a particular date, usually, at the end of its “fiscal year".
 of a business or an organisation at a particular date, usually, at the end of its fiscal year .")
43
Income Statement: The financial statement that shows whether the business earned a profit by subtracting expenses from revenues.

44
Breakeven analysis: A tool used to determine when a business will be able to cover all its expenses and begin to make a profit It includes: –Fixed costs –Variable costs –Income (Sales, Revenues) A break-even analysis examines the interaction among fixed costs,variable costs,prices and unit volume to determine that combination of elements in which revenues and total costs are equal. IMPORTANT FORMULA!!! NET INCOME= Sales Revenue-Variable Costs-Fixed costs

45
Break-even chart The point at which neither profit nor loss is made is known as the ‘break-even’ point. QUANTITY MONEY

46
Example: Break-Even Suppose we want to run a ‘coffee-shop’. We have determined that the level of fixed costs (salaries,rent..) necessary to run our coffee shop on a monthly basis is $9000. In addition a cup of coffee that we sell for $1 costs us $0.25 for the bulk coffee, filters and water. a)How many cups must we sell in order to break-even? Sensitivity analysis: Analysis of the effect on a project's profitability due to changes in sales, cost, etc... b) How many cups should we sell in order to break-even if we raise the price to $1.50?
 necessary to run our coffee shop on a monthly basis is $9000. In addition a cup of coffee that we sell for $1 costs us $0.25 for the bulk coffee, filters and water. a)How many cups must we sell in order to break-even. Sensitivity analysis: Analysis of the effect on a project s profitability due to changes in sales, cost, etc... b) How many cups should we sell in order to break-even if we raise the price to $")
47
Time value of money Simple Interest formula : F= P(1+i) n P: What is given (Current money) i: Annual Interest Rate n : number of interest periods F: Amount of money to be attained in the future. Which alternative would you choose? a)Receiving $100 now and putting the money in the bank for 2 years at 10% interest? b)Receiving $120 at the end of two years?
Receiving $100 now and putting the money in the bank for 2 years at 10% interest. b)Receiving $120 at the end of two years .")
48
Some situations in which Engineering Economy plays a crucial role are: Choosing the best firm among alternative firms to transport materials. Selecting the most suitable robot for a welding operation on an automotive assembly line, Making a recommendation about whether jet airplanes for an overnight delivery service should be purchased or rented, Determining the optimal staffing plan for a computer help desk.

49
Engineering Economic Analysis Procedure can be summarized as follows: 1.Problem recognition, definition, and evaluation Development of feasible alternatives. 2.Development of the outcomes and cash flows for each alternative. 3.Selection of a criterion (or criteria) to serve the long-term interests of the owners of the organization. 4.Analysis and comparison of the alternatives based on cash-flow estimates for the feasible alternatives. 6. Selection of the preferred alternative. 7. Performance monitoring and post-evaluation of results. Engineering Design Process includes: 1.Problem / need definition. 2.Problem / need formulation and evaluation. 3.Synthesis of possible solutions (alternatives). 4.Analysis, optimization, and evaluation. 5.Specification of preferred alternative. 6.Communication.
 to serve the long-term interests of the owners of the organization. 4.Analysis and comparison of the alternatives based on cash-flow estimates for the feasible alternatives. 6. Selection of the preferred alternative. 7. Performance monitoring and post-evaluation of results. Engineering Design Process includes: 1.Problem / need definition. 2.Problem / need formulation and evaluation. 3.Synthesis of possible solutions (alternatives). 4.Analysis, optimization, and evaluation. 5.Specification of preferred alternative. 6.Communication..")
50
3.5. Operations Research and modeling concepts Application of mathematics and the scientific methods to determine the best way to design and operate a system with allocation of scarce resources. During World War II, military leaders asked scientists and engineers to analyze several military problems. As a result, the scientists developed some new methods, they are, later, called Operations Research or Quantitative Sciences.

51
What type of problems may OR work with ? 1.A bank may want to minimize the weekly salary cost needed to ensure that the average time a customer waits in line is at most 3 minutes? Limited amount of service time in a bank. 2. On the average, how many customers can a teller serve per hour ? Limited number of machines while orders coming continuously at large amounts.

52
What type of problems may OR work with? 3. How many warehouses should be built? Effective usage of resources/ time depends on the amount of money spent for labor, machinery, energy, etc... 4. What would be the unit change in production cost when labor capacity increases %5 ? Limited number of clerks in a bank while the number of customers increases continuously.

53
How operations research approaches the problems Linear programming models Sensitivity analysis Transportation problems CPM/PERT Integer programming models Inventory models Queuing models Dynamic programming models

54
OR-Linear Programming :Example XYZ manufactures luxury cars and trucks. The company believes that its most likely customers are high income women and men. To reach these groups, XYZ has decided to give 1-minute commercials on two types of programs: comedy shows and football games. –Each comedy commercial is seen by 7 million high-income women and 2 million high income men. –Each football commercial is seen by 2 million high-income women and 12 million high-income men. –A 1 minute comedy ad costs $50,000 and a 1 minute football ad costs $100,000. Dorian would like the commercials to be seen by at least 28 million high-income women and 24 million high income men. Use linear programming to determine how XYZ can meet its advertising requirements at minimum cost.

55
Management Information Systems Every firm has an information system. Data for decision-making and other activities are collected, classified, summarized and processed to produce information. Generally decision-making is carried out at three different levels in the firm. These are: 1.Strategic level decisions 2.Tactical Level Decisions 3.Operational level decisions.

56
Strategic level decisions 1.Facility location 2.Merging 3.Product/service line formation 4.Product/service mix 5.Expansion plans Usually, this kind of decisions span for 3-5 years.

57
Tactical Level Decisions 1.Budget formulation 2.Personnel problems 3.Layout decisions 4.Funds-flow analysis. These decisions are of medium-range and generally span from 1 month to 1 year.

58
Operational level decisions 1.Inventory control problems 2.Quality control problems 3.Worker assignment to the jobs 4.Procurement and shipping operations. These decisions are usually classified as daily decisions.

59
Information is needed in an organization about: Customers Market Suppliers Competitors Trends in government regulations Environmental constraints

60
Management Information System Activities 1.Recording of general data at its source Sales Orders Inspection results Machine breakdowns Personnel records 2.The checking of data to ensure that they were recorded correctly This step is called verifying step. An example could be “verifying scrap records in monthly basis”.

61
Management Information System Activities (continued) 3. Classifying 4. Sorting 5. Summarizing 6. Calculating 7. Storing 8. Retrieving 9. Reproducing 10. Communicating

62
3.7. Ergonomics and Work Study 3.7.1 Ergonomics An important dimension of human performance is the various ways in which human beings interact with the work and work environment. Important Interfaces to be considered for design are 1.Work environment 2.Social structures at work 3.Machines, displays and controls 4.Information/communication systems 5.Organizational/supervisory structure

63
Human factors/Ergonomics Deals with the design of safe, human compatible, productive systems based on the requirements of the previously stated interfaces. Provides a tool to design task/machine and the work environment according to different human performance characteristics. Human performance characteristics fall into two broad categories; physiological and psychological.

64
Human Performance Characteristics Physiological Performance characteristics Psychological Performance characteristics Physiological performance characteristics have to do with the physical aspects of human activities (work activities) such as physiological conditions of the workers. Psychological performance characteristics are those dealing with the mental aspects of human activities, such as stress, boredom, monotony, and motivation. Environmental aspects are, also, important issues that management should consider. Some of the precautions are obliged by law.

65
What type of problems? Problems related to Employee health and work safety Job accidents and job risks Lost production time due to job accidents Decrease in labor productivity due to improper or poor environmental conditions Job stress due to improper or poor work design Poor illimunation (due to improper lighting ) Unacceptable noise level in a mechanical shop, especially, above the accepted threshold limits.
 Unacceptable noise level in a mechanical shop, especially, above the accepted threshold limits..")
66
Why do these problem exist? System standards and hard competition make firms more conscious about employee health and insurance conditions Work methods, environmental conditions directly have impact on productivity-another competitive advantage Improper noise, illumination levels and job design directly create quality problems and nonconformities in the overall performance of the system

67
How Ergonomics approaches the problem? Analyzes the system from the following point of views: General environment Human factors- productivity and safety Machinery and tools Perception-stimulus and response Management perspectives

68
How Ergonomics approaches the problem? General environment By controlling illumunation level, noise and vibration level, Climate, toxic substance effects and radiation effects Human factors-productivity and safety By using anthropometry, energy consumption, job load effects, individual capacity, capability, experience, creativity, social environmental effects in the design of work

69
How Ergonomics approaches the problem? Contd.. Machinery and tools Machinery and tools used to make work efficient Perception-stimulus and response Design of displays, reaction and response times Management perspectives Approach of management in improving work conditions and work environment.

70
How Ergonomics approaches the problem ? -digital indicators -displays and controls -machinery and -human mechanics -sitting and standing positions Perception/processing and decision making Displayed information Managerial effects -financial -projects -auditing -improvement Machinery effects -Set up -maintenance -improvement -renewal General environmental conditions Activation of controls

71
Possible outputs from ergonomic design Better illumination system in a paint shop for eye-control Decreased number of ear problems in a press shop Decreased number of work accidents in a machinery shop Special design of a computer desk for a clerk working with a computer 12 hours/day in a bank

72
2.7.2 Work-Study Work-study is composed of those techniques, particularly, method study and work measurement that are used to examine the human work in all its contexts. It is performed by, systematically, investigating all the factors that affect the efficiency and economy of the situation being considered in order to improve processes.

73
Method study (motion study) is the systematic recording and critical examination of the existing and proposed ways of doing work as a means of developing and applying easier, economic, and more effective methods of work. The objective of such study is effective and efficient use of time, human effort, materials, and capital.

74
Method Study Method study is the process of subjecting work to systematic and critical examination in order to make it more effective and/or more efficient. The process is often described by its main steps of: 1.Select the work to be studied; 2.Record all relevant information about that work; 3.Examine the recorded information; 4.Develop an improved way of doing things; 5.Install the new method as standard practice; 6.Maintain the new standard proactive.

75
Tools Used for Method Study Flow process charts Left-hand/ right-hand charts. The following questions may be asked when analyzing a method: 1.Is this activity necessary? 2.Can it be eliminated or combined with another activity? 3.How can the activities be sequenced so that a better result would be obtained? 4.Can this method be improved? 5.Is this activity carried out by the right person?

76
Flow Process Charts They are, generally, prepared for both present and proposed methods separately in order to see how much improvement is realized. The final aim with the proposed method is to decrease transfer and waiting times as much as possible.

77
OPERATION : A main step, where the part, material or product is usually modified or changed INSPECTION : Indicates a check for quality or quantity TRANSPORT : The movement of workers, materials or equipment STORAGE : Controlled storage in which material is received into or issued from a store, or an item is retained for reference purposes DELAY or TEMPORARY STORAGE : Indicates a delay in the process, or an object laid aside until required Flow Process Chart-Symbols

79
Flow Process Chart-Symbols: Example

80
Left-Right Hand Chart

81
Work measurement (time study) Work measurement (time study) is the application of techniques designed to establish the standard time, that is, the time for a qualified worker to carry out a specified job at a defined level of performance. The time standards may be used for 1.Planning and scheduling purposes a)Increasing labor productivity b)Determining loads of successive workers 2.Estimating and controlling the labor cost. a) Determining capacity usage ratios of workers and machines
Increasing labor productivity b)Determining loads of successive workers 2.Estimating and controlling the labor cost. a) Determining capacity usage ratios of workers and machines.")
83
Work Measurement Work measurement is the process of establishing the time that a given task would take when performed by a qualified worker working at a defined level of performance. The basic procedure, irrespective of the particular measurement technique being used, consists of three stages: 1.An analysis phase in which the job is divided into convenient, discrete components known as work elements, 2.A measurement phase in which the specific measurement technique is used to establish the time required to complete each element of work, and 3.A synthesis phase in which the various elemental times are added together with appropriate allowances to construct the standard time for the complete job.

84
Selection of the most appropriate method for each individual situation to be measured depends on several factors which include: 1.The length of the job to be measured in time units, 2.The precision which is appropriate for the type of work in terms of time units (i.e. Should it be in minutes, hundredths or thousandths of a minute), 3.The general cycle-time of the work, i.e. does it take seconds, minutes or days to complete.
, 3.The general cycle-time of the work, i.e. does it take seconds, minutes or days to complete..")
85
The choice of a suitable measurement technique depends on a number of factors including: 1.Purpose of the measurement, 2.Level of detail required, 3.Time available for the measurement, 4.Existence of available predetermined data, and 5.Cost of measurement. To some extent there is a trade off between some of these factors.

86
Techniques of Work Measurement 1.Time Study. 2.Analytical Estimating. 3.Predetermined Motion Time Systems. 4.Activity Sampling (Work Sampling).
..")
87
Time study is a structured process of directly observing and measuring (using a timing device) human work in order to establish the time required for completion of the work by a qualified worker when working at a defined level of performance. It follows the basic procedure of systematic work measurement of : 1.Analysis and division of the work into small, easily-measurable components or elements, 2.Measurement of those components, and 3.Synthesis from those measured components to arrive at a time for the complete job.

88
Analytical estimating is a structured, estimating work measurement technique in which 1.A task is analysed into its basic component operations or elements and 2.Standard times, where available from another source, are applied to these elements. When no such times are available, they are estimated based on experience of the work under consideration. The estimating is carried out by a skilled and experienced worker who has had additional training in the process of estimating.

89
Predetermined Motion Time Systems (PMTS) are work measurement systems 1.Based on the analysis of work into basic human movements, 2.Classified according to the nature of each movement and the conditions under which it is made. Tables of data provide a time, at a defined rate of working, for each classification of each movement. The first PMTS were designed to provide times for detailed manual work and thus consisted of fundamental movements (reach, grasp, move, etc) and associated times.
 and associated times..")
90
Activity Sampling (Work Sampling) or Rated Activity Sampling is a method based on the observer making snap observations at random or systematic sample times, observing what the operator(s) is doing at the times of those observations. Usually, a large number of instantaneous observations are made at random times of one or more workers or equipment items over a representative period of time. When the study is complete, the ratio of the number of observations in a particular work activity to the total number of observations in the study yields an estimate of the proportion of total time spent in that activity.

91
2.7.5 Concept of Standard Time In the business world the standard times are needed for: 1.Planning the work of a workforce, 2.Managing jobs, to decide how many workers it would need to complete certain jobs, 3.Scheduling the tasks allocated to people, 4.Costing the work for estimating contract prices and costing the labor content in general, 5.Increasing labor productivity, 6.Determining work content of successive workers in a production line to equalize the work contents, 7.Determining capacity usage ratios of workers and machines, 8.Calculating the efficiency or productivity of workers - and from this, 9.Providing fair returns on possible incentive bonus payment schemes.

92
These standard times are set on how long a trained, experienced worker would take to do the task at a defined level of pace or performance. They are set by specially trained and qualified observers using the most appropriate methods or techniques. Actual time: It is the observed time required for an operator to perform a task. Basic time (Normal time): This is the time required for an average, trained operator to perform a task under usual working conditions and working at a normal pace. It does not include allowances for personal needs and delays that would be necessary if the task were done all 8 hours.
: This is the time required for an average, trained operator to perform a task under usual working conditions and working at a normal pace. It does not include allowances for personal needs and delays that would be necessary if the task were done all 8 hours..")
93
Rating: When someone is doing work his/her way of working will vary throughout the working period and will be different from others doing the same work. This is due to differing speeds of movement, effort, dexterity and consistency. The purpose of rating is to adjust the actual time to a standardized basic time. Rating on a scale of 100 is known as standard rating Example: An observer times an element as 30 seconds and because it is performed more slowly than the standard 100, he rates it as 95. Thus the basic time is 95% of 30 or 28.5 seconds. The formula is: Basic Time = (Actual Time x Rating) / 100
 / 100.")
94
Allowances: Extra time is allowed for various conditions, the main ones being relaxation allowance for: 1.Recovery from the effort of carrying out specified work under specified conditions (fatigue allowance), 2.Attention to personal needs, 3.Adverse environmental conditions, and 4.Others concerned with machine operations.
, 2.Attention to personal needs, 3.Adverse environmental conditions, and 4.Others concerned with machine operations.")
96
The standard time must include time for all elements in the operation, and in addition, it must contain all necessary allowance (i.e., personal allowances, fatigue allowances, and delay allowances). In other words, standard time is equal to the normal time plus the allowances. The following formula can be used to calculate the standard time: 100 Standard Time = Normal Time x 100-Allowance in percent

97
Example: Assume that in a particular operation of assembling an electric switch the operator gave a consistent performance throughout the cycle and throughout the study, and the total selected time was 0.80 minute. With a rating factor for the study of 110 percent, Normal time = Actual time x (Rating in percent / 100) Normal time = 0.80 x ( 110 / 100) = 0.88 minute If an allowance of 5 % for personal allowance were made on the assembly operation, Standard Time = Normal Time x (100/ (100-Allowance in percent)) Standard Time = 0.88 x (100/ (100 - 5)) = 0.88 x ( 100 / 95 ) = 0.926 minutes
 Normal time = 0.80 x ( 110 / 100) = 0.88 minute If an allowance of 5 % for personal allowance were made on the assembly operation, Standard Time = Normal Time x (100/ (100-Allowance in percent)) Standard Time = 0.88 x (100/ ( )) = 0.88 x ( 100 / 95 ) = minutes.")
98
Some Definitions Relating to Job Design Job Evaluation is a systematic procedure to evaluate the work content of each job to establish a hierarchy of jobs. A Job Description gives a brief definition of the job and presents a detailed account of the job content based on the results of the job analysis. A Job Specification specifies the skill and responsibility levels required for the job, along with mental, physical, educational and environmental requirements that the job demands upon the worker. Job evaluation studies are, mainly, used to classify workers and staff into wage groups. The findings of the job evaluation are also used for the execution of employment and training activities.

99
2.8. Statistics and Simulation 2.8.1 Statistics What is the probability that a card drawn at random from a deck of cards will be an ace? In this case there are four favorable outcomes: 1.The ace of spades, 2.The ace of hearts, 3.The ace of diamonds, and 4.The ace of clubs. Since of the 52 cards in the deck, 4 are aces, the probability is 4/52. In general, the probability of an event is the number of favorable outcomes divided by the total number of possible outcomes. (This assumes the outcomes are all equally likely). Since each of the 52 cards in the deck represents a possible outcome, there are 52 possible outcomes.
. Since each of the 52 cards in the deck represents a possible outcome, there are 52 possible outcomes..")
100
The same principle can be applied to the problem of determining the probability of obtaining different totals from a pair of dice. A) Calculate the probability that the sum of the two dice will equal 5, Since four of the outcomes have a total of 5 (1,4; 2,3; 3,2; 4,1), the probability of the two dice adding up to 5 is 4/36 = 1/9. B), Calculate the probability of obtaining a sum of 12 Computed by dividing the number of favorable outcomes (there is only one, i.e. (6,6)) by the total number of outcomes (36). The probability is therefore 1/36. Possible outcomes of the totals of 2 dies
 Calculate the probability that the sum of the two dice will equal 5, Since four of the outcomes have a total of 5 (1,4; 2,3; 3,2; 4,1), the probability of the two dice adding up to 5 is 4/36 = 1/9. B), Calculate the probability of obtaining a sum of 12 Computed by dividing the number of favorable outcomes (there is only one, i.e. (6,6)) by the total number of outcomes (36). The probability is therefore 1/36. Possible outcomes of the totals of 2 dies.")
101
Conditional probability A conditional probability is the probability of an event given that (knowing that) another event has occurred. For example, what is the probability that the total of two dice will be greater than 8 given that the first die is a 6? This can be computed by considering only outcomes for which the first die is a 6. Then, determine the proportion of these outcomes that total more than 8. All the possible outcomes for two dice are shown in the previous section. There are 6 outcomes for which the first die is a 6, and of these, there are four that total more than 8 (6,3; 6,4; 6,5; 6,6).
..")
102
The probability of a total greater than 8 given that the first die is 6 is therefore 4/6 = 2/3. More formally, this probability can be written as: P (total>8 | Die 1 = 6) = 2/3 In this equation, the expression to the left of the vertical bar represents the event and the expression to the right of the vertical bar represents the condition. Thus it would be read as "The probability that the total is greater than 8 given that Die 1 is 6 is 2/3." In more abstract form, P(A|B) is the probability of event A given that event B occurred.
 = 2/3 In this equation, the expression to the left of the vertical bar represents the event and the expression to the right of the vertical bar represents the condition. Thus it would be read as The probability that the total is greater than 8 given that Die 1 is 6 is 2/3. In more abstract form, P(A|B) is the probability of event A given that event B occurred..")
103
Probability of A and B a.If A and B are Independent A and B are two events. If A and B are independent, then the probability that events A and B both occur is: P(A and B) =P(A) x P(B) In other words, the probability of A and B both occurring is the product of the probability of A and the probability of B. What is the probability that a fair coin will come up with heads twice in a row? Two events must occur: a head on the first toss and a head on the second toss. Since the probability of each event is 1/2, the probability of both events is: 1/2 x 1/2 = 1/4.
 =P(A) x P(B) In other words, the probability of A and B both occurring is the product of the probability of A and the probability of B. What is the probability that a fair coin will come up with heads twice in a row. Two events must occur: a head on the first toss and a head on the second toss. Since the probability of each event is 1/2, the probability of both events is: 1/2 x 1/2 = 1/4..")
104
Now consider a similar problem: Someone draws a card at random out of a deck, replaces it, and then draws another card at random. What is the probability that the first card is the ace of clubs and the second card is a club (any club)? Since there is only one ace of clubs in the deck, the probability of the first event is 1/52. Since 13/52 = 1/4 of the deck is composed of clubs, the probability of the second event is 1/4. Therefore, the probability of both events is: 1/52 x 1/4 = 1/208.
. Since there is only one ace of clubs in the deck, the probability of the first event is 1/52. Since 13/52 = 1/4 of the deck is composed of clubs, the probability of the second event is 1/4. Therefore, the probability of both events is: 1/52 x 1/4 = 1/208..")
105
b. If A and B are Not Independent If A and B are not independent, then the probability of A and B is P(A and B) = P(A) x P(B|A) where P(B|A) is the conditional probability of B given A. If someone draws a card at random from a deck and then, without replacing the first card, draws a second card, what is the probability that both cards will be aces? Event A is that the first card is an ace. Since 4 of the 52 cards are aces, P(A) = 4/52 = 1/13. Given that the first card is an ace, what is the probability that the second card will be an ace as well? Of the 51 remaining cards, 3 are aces. Therefore P(B|A) = 3/51 = 1/17 and the probability of A and B is: 1/13 x 1/17 = 1/221.
 = P(A) x P(B|A) where P(B|A) is the conditional probability of B given A. If someone draws a card at random from a deck and then, without replacing the first card, draws a second card, what is the probability that both cards will be aces. Event A is that the first card is an ace. Since 4 of the 52 cards are aces, P(A) = 4/52 = 1/13. Given that the first card is an ace, what is the probability that the second card will be an ace as well. Of the 51 remaining cards, 3 are aces. Therefore P(B|A) = 3/51 = 1/17 and the probability of A and B is: 1/13 x 1/17 = 1/221..")
106
When a coin is flipped, the outcome is either a head or a tail; when a magician guesses the card selected from a deck, the magician can either be correct or incorrect; when a baby is born, the baby is either born in the month of March or is not. In each of these examples, an event has two mutually exclusive possible outcomes.

107
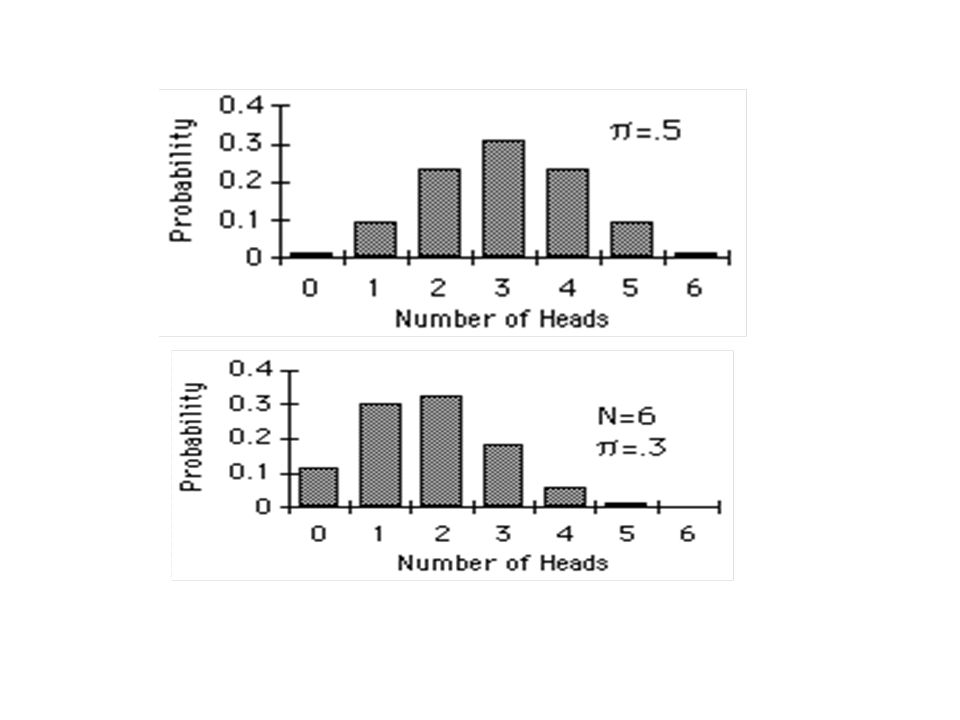
For convenience, one of the outcomes can be labeled "success" and the other outcome "failure“. If an event occurs N times (for example, a coin is flipped N times), then the binomial distribution can be used to determine the probability of obtaining exactly r successes in the N outcomes. The binomial probability for obtaining r successes in N trials is: where P(r) is the probability of exactly r successes, N is the number of events, and π is the probability of success on any one trial. This formula assumes that the events are: 1.Dichotomous (fall into only two categories) 2.Mutually exclusive 3.Independent and 4.Randomly selected.
, then the binomial distribution can be used to determine the probability of obtaining exactly r successes in the N outcomes. The binomial probability for obtaining r successes in N trials is: where P(r) is the probability of exactly r successes, N is the number of events, and π is the probability of success on any one trial. This formula assumes that the events are: 1.Dichotomous (fall into only two categories) 2.Mutually exclusive 3.Independent and 4.Randomly selected..")
108
What is the probability of obtaining exactly 3 heads if a fair coin is flipped 6 times? For this problem, N =6, r=3, and π =0.5. Therefore, Notice that, in the following distributions, for π=0.5, the distribution is symmetric where as for π=0.3, the distribution has a positive skew. Often the cumulative form of the binomial distribution is used. To determine the probability of obtaining 3 or more successes with N=6 and π =0.3, you compute P(3) + P(4) + P(5) + P(6). Therefore, the probability of at least three success is calculated as the sum (0.1852 + 0.0595 + 0.0102 + 0.0007) = 0.2556.
 + P(4) + P(5) + P(6). Therefore, the probability of at least three success is calculated as the sum ( ) =")
110
Questions on Statistics: 1.What is the probability of rolling a pair of dice and obtaining a total score of 10 or more? 2.A box contains three black pieces of cloth, two striped pieces, and four dotted pieces. A piece is selected randomly and then placed back in the box. A second piece is selected randomly. What is the probability that: a.both pieces are dotted? b.the first piece is black and the second piece is dotted? c.one piece is black and one piece is striped? 3.A card is drawn at random from a deck. What is the probability that it is an ace or a king? 4.A card is drawn at random from a deck. What is the probability it is either a red card, an ace, or both? 5.Two cards are drawn from a deck (without replacement). What is the probability they are both diamonds? Anwers 1: 1/6, 2: a. 16/81, b. 4/27, c. 4/27, 3: 2/13, 4: 7/13, 5: 1/17
. What is the probability they are both diamonds. Anwers 1: 1/6, 2: a. 16/81, b. 4/27, c. 4/27, 3: 2/13, 4: 7/13, 5: 1/17.")
111
Simulation Many situations arise involving problems for which no analytical solution can be found. Solutions for complex dynamic problem situations or complex operating systems can be considered as examples of such cases.

112
What Type of Problems? An increase in the average waiting time of customers in a service facility. Very long service times in a restaurant. An increase in the average number of customers waiting for service. Long queues in front of bottleneck machines. Low machine utilization. High average throughput time of products.

113
Why These Problems Exist? Arrival rates to service systems (hospitals, banks, etc...) vary in practice. The problem environment is affected by more than one specific factor. Sometimes, there arises a need to compare similar alternative solutions to select the best one.
 vary in practice. The problem environment is affected by more than one specific factor. Sometimes, there arises a need to compare similar alternative solutions to select the best one..")
114
How Simulation Approaches to These Problems? Helps to prepare an abstract model of the real life situation. Makes use of computer packages, such as ARENA, to evaluate the system under study. Keeps the track of necessary statistics to measure the performance and reliability of the system.

115
Outputs from the Usage of Simulation Comparative statistics of proposed and existing systems. Average utilization rates of machines, tellers, and the resources in order to decide capacity expansions or make/buy decisions. More effective design proposals for current system changes in a bank or in a factory.

116
Simulation Tools 1.General purpose tools CRISTAL BALL 2.Continuous simulation PIPESIM : flow simulation software for wells and pipeline systems SPICE - Circuit simulation 3.Discrete simulation ARENA ATM networks simulation (communications systems) CINEMA GPSS PROMODEL QUEST SIMAN SIMFACTORY SIMNET SIMSCRIPT SLAM II 4.Systems Dynamics DYNAMO POWERSIM
 CINEMA GPSS PROMODEL QUEST SIMAN SIMFACTORY SIMNET SIMSCRIPT SLAM II 4.Systems Dynamics DYNAMO POWERSIM")
117
2.9. Quality Planning Quality is indispensable for customer satisfaction and it is one of the key factors to gain competitive advantage. It directly, influences the marketability of a product/service. Quality is the total composite product (or service) characteristics of marketing, production and maintenance through which the product (or service) is expected to meet the expectations of the customer.
 characteristics of marketing, production and maintenance through which the product (or service) is expected to meet the expectations of the customer..")
118
Objectives of Quality Planning 1.Improve Quality 2.Decrease Costs 3.Improve Productivity 4.Decrease Price 5.Increase Market Share 6.Stay in Business 7.Provide More Jobs 8.Increase Return on Investment

119
Expected Outputs from Quality Planning Decreased number of customer complaints Better process control with less defective items Decreased labor time for inspection Root cause discovery of the main problem thus more reliable products Increased market share with less scraps and waste

120
Why quality problems arise? Increasing competition among the companies. Demand for more functional characteristics but with less cost. Improvement of more efficient methods at low cost. Tendency to decrease repair cost, number of defectives, and customer rejected products.

121
Dimensions of quality Performance~ Ability to perform the intended job Reliability~ Frequency of being in service Durability~ Effective service life, long-lasting Serviceability~ Ease and availability of low- cost service Aesthetics~ Visual appeal Features~ Abilities beyond the basic function Perceived quality ~ Reputation, customer’s perception of the product Conformance to standards~ Meeting designer’s specifications and requirements

122
Basic Steps to Solve Quality Problems Identify problem causes –recognize the symptoms Define the problem –Agree on the problem and set boundaries Investigate the problem –Collect data Analyze the problem –Use quality tools to aid Solve the problem –Develop the solution and implement Confirm the solution –Follow up to ensure that the solution is effective

123
Quality control vs. quality assurance Quality Control: Operational techniques and/or activities which sustain a defined quality of product or service that will satisfy given needs. Related with operational, day-to-day activities Inspection and complaint-centered Observation and measurement- based Aims at limiting or controlling the losses.

124
Quality Assurance: All those planned and systematic actions necessary to provide adequate confidence that a product or service will satisfy the given requirements for quality. It is planned, systematic, and proactive. It has three dimensions: 1.People, 2.Products, 3.Processes. Aims at 1.Continuity and standardization of the processes, 2.Prevention and avoiding the losses.

125
Quality of design vs. Quality of conformance Quality of design: Grades/levels of quality intentionally build in during the design phase Expresses how well the design of product/service agrees with the customer expectations and needs Quality of conformance: Expresses how well the product /service conforms to the specifications required by the design Influenced by many factors such as manufacturing processes selected, training/ supervision/motivation of the workforce, QA system used.

126
Quality Tools 1.Cause and Effect Diagrams 2.Flow Charts 3.Check-sheets 4.Check Lists 5.Histograms 6.Pareto Charts 7.Control Charts 8.Scatter Diagrams 9.Benchmarking 10.Quality cost analysis 11.Reliability

127
1.Cause and Effect Diagrams The cause and effect diagram, also known as the "fishbone" or "Ishikawa" diagram, is used to systematically list all the different causes that can be attributed to a specific problem (or effect). A cause-and-effect diagram can help identify the reasons why a process goes out of control.

129
Benefits 1.Breaks problems down into bite-size pieces to find root cause. 2.Fosters team work. 3.Common understanding of factors causing the problem. 4.Road map to verify picture of the process. 5.Follows brainstorming relationship.

130
Sample Incorrect shipping documents Manpower Materials Methods Machine Environment Keyboard sticks Wrong source info Wrong purchase order Typos Source info incorrect Didn’t follow proc. Glare on display Temp. No procedure No communications No training Software problem Corrupt data Poor training

131
2. Flow Charts Visual illustration of the sequence of operations required to complete a task by pictures, symbols or text supported with lines, arrows on lines show direction of flow. Enables modelling of processes; roblems/opportunities and decision points etc. Purpose: Schematic drawing of the process to measure or improve. Starting point for process improvement Potential weakness in the process are made visual. Picture of process as it should be.

132
Benefits: 1.Identify process improvements 2.Understand the process 3.Shows duplicated effort and other non-value- added steps 4.Clarify working relationships between people and organizations 5.Target specific steps in the process for improvement.

133
Flow Chart Toolbox

134
Sample Flow Chart

135
3. Checksheets They are used for collecting and organizing measured or counted data and providing input data for other quality tools Benefits: 1.To collect data in a systematic and organized manner 2.To determine source of a problem 3.To facilitate classification of data (stratification)
.")
136
Sample Check-sheets

137
4. Histograms They are used to determine the spread or variation of a set of data points in a graphical form How is it done? 1.Collect data 2.Determine the range of the data 3.Calculate the size of the class interval 4.Divide data points into classes 5.Determine the class boundary 6.Count # of data points in each class 7.Draw the histogram

138
Sample Histogram Benefits Allows you to understand at a glance the variation that exists in a process The shape of the histogram will show process behavior The shape and size of the dispersion will help identify otherwise hidden sources of variation Used to determine the capability of a process Starting point for the improvement process Stable process, exhibiting bell shape

139
IE 102 MIDTERM RESULTS Descriptive Statistics: IE102MIDTERMGRADES Variable N N* Mean Median TrMean StDev IE102MID 80 11 60,01 58,00 60,15 21,26 Variable SE Mean Minimum Maximum Q1 Q3 IE102MID 2,38 13,00 104,00 45,00 78,75

140
5. Pareto Charts They are used to prioritize problems. How is it done? 1.Create a preliminary list of problem classifications. 2.Tally the occurrences in each problem classification. 3.Arrange each classification in order from highest to lowest 4.Construct the bar chart

141
Sample Pareto Chart

142
Pareto Chart Benefits Pareto analysis helps graphically display results so the significant few problems emerge from the general background It tells you what to work on first

143
Weighted Pareto Weighted Pareto charts use the quantity of defects multiplied by their cost to determine the order.

144
Weighted Pareto

145
7. Control Charts They are used for continuous monitoring and charting of a process while it is operating, to warn when the process is moving away from the predetermined limits. Typically the upper and lower control limits will be three standard deviations away from the mean. All points outside the control limits should be investigated and corrected. They are used to predict expected product outcome. Benefits: 1.Predict process out of control and out of specification limits 2.Distinguish between specific, identifiable causes of variation 3.Can be used for statistical process control

146
How is it done? 1.The data must have a normal distribution (bell curve). 2.Have 20 or more data points. Fifteen is the absolute minimum. 3.List the data points in time order. 4.Determine the range between each of the consecutive data points. 5.Find the mean or average of the data point values. 6.Calculate the control limits 7.Set up the scales for your control chart. 8.Draw a solid line representing the data mean. 9.Draw the upper and lower control limits. 10.Plot the data points in time sequence.

148
Next, look at the upper and lower control limits. If your process is in control, 99.73% of all the data points will be inside those lines. The upper and lower control limits represent three standard deviations on either side of the mean. Divide the distance between the centerline and the upper control limit into three equal zones representing three standard deviations. Sample Control Chart

149
Basic Control Charts interpretation rules: Specials are any points above the UCL or below the LCL A Run violation is seven or more consecutive points above or below the center (20-25 plot points) A trend violation is any upward or downward movement of five or more consecutive points or drifts of seven or more points (10-20 plot points) A 1-in-20 violation is more than one point in twenty consecutive points close to the center line
 A trend violation is any upward or downward movement of five or more consecutive points or drifts of seven or more points (10-20 plot points) A 1-in-20 violation is more than one point in twenty consecutive points close to the center line")
150
8. Scatter Diagrams They are used to identify the correlations that might exist between a quality characteristic and a factor that might be driving it. Dots representing data points that are scattered on the diagram. The extent to which the dots cluster together in a line across the diagram shows the strength with which the two factors are correlated.

151
How is it done? 1.Decide which paired factors you want to examine. Both factors must be measurable on some incremental linear scale. 2.Collect 30 to 100 paired data points. 3.Find the highest and lowest value for both variables. 4.Draw the vertical (y) and horizontal (x) axes of a graph. 5.Plot the data 6.Title the diagram The shape that the cluster of dots takes will tell you something about the relationship between the two variables that you tested.
 and horizontal (x) axes of a graph. 5.Plot the data 6.Title the diagram The shape that the cluster of dots takes will tell you something about the relationship between the two variables that you tested..")
152
Sample Scatter Diagrams Benefits Helps identify and test probable causes. By knowing which elements of your process are related and how they are related, you will know what to control or what to vary to affect a quality characteristic.

153
9. Benchmarking A structured approach for identifying the best practices from industry and government, and comparing and adapting them to the organization's operations. 10. Quality cost analysis Analysis of the costs that results from the fact that systems, processes, products and services are imperfect. 11. Reliability The ability of an item to perform a required function under stated conditions for a specified period of time.

154
Among the emerging philosophies about quality assurance systems, Total Quality Control (TQC) and Total Quality Management (TQM) systems play important roles. Total Quality Control is an effective system for integrating the quality-development, quality-maintenance and quality-improvement efforts of various groups in an organization. Its objective is to enable production and marketing at the most economical levels which allow for full customer satisfaction.

155
TQM is a systems approach for the continuous improvement of all the organizational processes through total participation of all the employees. It results in high quality products/services to attain customer satisfaction Total means everybody associated with the company is involved in continuous improvement, including suppliers and customers if possible. Quality means customer’s expressed and implied needs and requirements are met fully. Management implies that the executives are fully committed and involved.

156
Proper TQM practice includes: Employee empowerment Teamwork Participative management Customers, suppliers and vendors becoming partners It is supported by: Problem-solving tools and techniques Performance measurement Systematic analysis of both products and services

157
Benefits of TQM Improved quality Increased customer satisfaction Higher productivity More efficient processes Lower cost More time for innovation and creativity Higher employee morale Increased market share Higher profits

158
2.10. Supply Chain Modeling 2.10.1. Introduction A supply chain is a network of facilities that 1.Performs the functions of procurement of materials, 2.Transformation of these materials into intermediate and finished products, and 3.The distribution of these finished products to customers. Supply chains exist in both service and manufacturing organizations.

159
A Typical Supply Chain: Stages & Flows Manufacturers Wholesale Distributors Customers Retailers Suppliers Information Flow Material Flow Cash Flow Information flow: data Material flow: products and semi-finished products, etc. Financial flow:cash, etc. STAGES IN A SC: Suppliers Manufacturers Wholesale Distributors Retailers Customers

160
Typical Supply Chain for a Manufacturer/Service Provider Supplier Storage } Mfg.StorageDist.RetailerCustomer Supplier } StorageService Customer

161
Source: Monczka et al., 2002161 A typical Supply Chain: Functions Storage Plant 1 Plant 2 Plant 3 Warehouse A B C Raw Materials Supply Points Raw Materials Storage ManufacturingFinished Goods Storage Markets Physical Supply - Materials ManagementPhysical Distribution - Marketing Logistics Transportation

162
Supply Chain Decisions We classify the decisions for supply chain management into two broad categories: 1.Strategic 2.Tactical 3.Operational. As the term implies, strategic decisions are made typically over a longer time horizon. Tactical decisions span from 1 week- several months On the other hand, operational decisions are short term, and focus on dayly activities. The effort in these type of decisions is to effectively and efficiently manage the product flow in the "strategically" planned supply chain.

163
There are four major decision areas in supply chain management: 1.Location, 2.Production, 3.Inventory, and 4.Transportation (distribution), and there are both strategic and operational elements in each of these decision areas.
, and there are both strategic and operational elements in each of these decision areas.")
164
Location Decisions The geographic placement of production facilities, stocking points, and sourcing points is the natural first step in creating a supply chain. The location of facilities involves a commitment of resources to a long-term plan. Once the size, number, and location of these facilities are determined, so are the possible paths by which the product flows through to the final customer.

165
These decisions are of great significance to a firm since they represent the basic strategy for accessing customer markets, and will have a considerable impact on revenue, cost, and level of service. These decisions should be determined by an optimization routine that considers production costs, taxes, duties, tariffs, distribution costs, etc.

166
Production Decisions The strategic decisions include 1.What Products to produce, 2.Which plants to produce them in, and 3.Allocation of suppliers to plants, plants to dc's, and dc's to customer markets. These decisions have a big impact on the 1.Revenues, 2.Costs and 3.Customer service levels of the firm.

167
Another critical issue is the capacity of the manufacturing facilities. Operational decisions focus on detailed production scheduling. These decisions include 1.The construction of the master production schedules, 2.Scheduling production on machines, 3.Equipment maintenance, 4.Workload balancing, and 5.Quality control measures.

168
Inventory Decisions These refer to means by which inventories are managed. Inventories exist, at every stage, of the supply chain as either 1.Raw materials, 2.Semi-finished products or 3.Finished goods. Their primary purpose to buffer against any uncertainty that might exist in the supply chain.

169
Since holding of inventories can cost anywhere between 20 to 40 percent of their value, their efficient management is critical in supply chain operations. It is strategic in the sense that top management sets goals, but most researchers have approached the management of inventory from an operational perspective. These include deployment strategies (push versus pull), control policies (the determination order quantities and reorder points, and setting safety stock levels at each stocking location).
, control policies (the determination order quantities and reorder points, and setting safety stock levels at each stocking location)..")
170
Transportation Decisions The mode choice aspects of these decisions are the more strategic ones. These are closely linked to the inventory decisions because of the trade-offs between the cost of using a particular mode of transport and the indirect cost of inventory associated with that mode. For example, while air shipments may be fast, reliable, and warrant lesser safety stocks, they are expensive. Meanwhile shipping by sea or rail may be much cheaper, but they necessitate holding relatively large inventories. Shipment sizes, routing and scheduling of equipment are key issues in effective management of the firm's transport strategy.

171
2.11. Project Management Project Management is the process of managing, allocating, and timing the resources in order to achieve a given objective as quick as possible. Project Management covers the following basic functions: 1.Planning 2.Organizing 3.Scheduling 4.Control

172
Project Management takes a hierarchical view of the project environment covering the following levels: 1.System 2.Program 3.Project 4.Task 5.Activity

173
system A project system consists of interrelated elements organized for the purpose of a common goal. It is the global realm within which project efforts are carried out program A program, usually, denotes very large and prolonged undertakings. project A project is an organized effort, of much smaller scope and duration than the program, to attain a useful result under the guidance of a leader known as the project manager, by providing and combining various resources readily available or attainable. task A task is an elemental component of a project. A project is normally composed of many tasks that contribute to the overall project goal. activity An activity can be defined as the smallest practically indivisible work element of the project.

174
Project Management Functions 1.Scope Management: 1.Scope Management: It refers to the process of directing and controlling the entire scope of the project with respect to a specific goal. 2.Quality Management: 2.Quality Management: It involves ensuring that the performance of a project conforms to specifications with respect to the expectations from the project. 3.Time Management: 3.Time Management: It involves effective and efficient use of time to facilitate the execution of the project expeditiously. 4.Cost Management: 4.Cost Management: It involves having an effective control over project costs through the use of reliable techniques of estimation, forecasting, budgeting, and reporting. It is a vital criterion for assessing project performance.

175
Risk Management: 5. Risk Management: It is the process of identifying, analyzing, and recognizing various risks and uncertainties that might affect the project. Human Resource Management: 6. Human Resource Management: By recognizing the fact that people make things happen, it involves the function of directing human resources throughout the project’s life cycle. Contract/Procurement Management: 7. Contract/Procurement Management: It involves the process of acquiring the necessary equipment, tools, services, and resources needed to successfully accomplish project goals. Communications Management: 8. Communications Management: It refers to the proper organization, routing, and control of information within the project environment needed to facilitate work.

Similar presentations


>")


