Download presentation
Presentation is loading. Please wait.

1
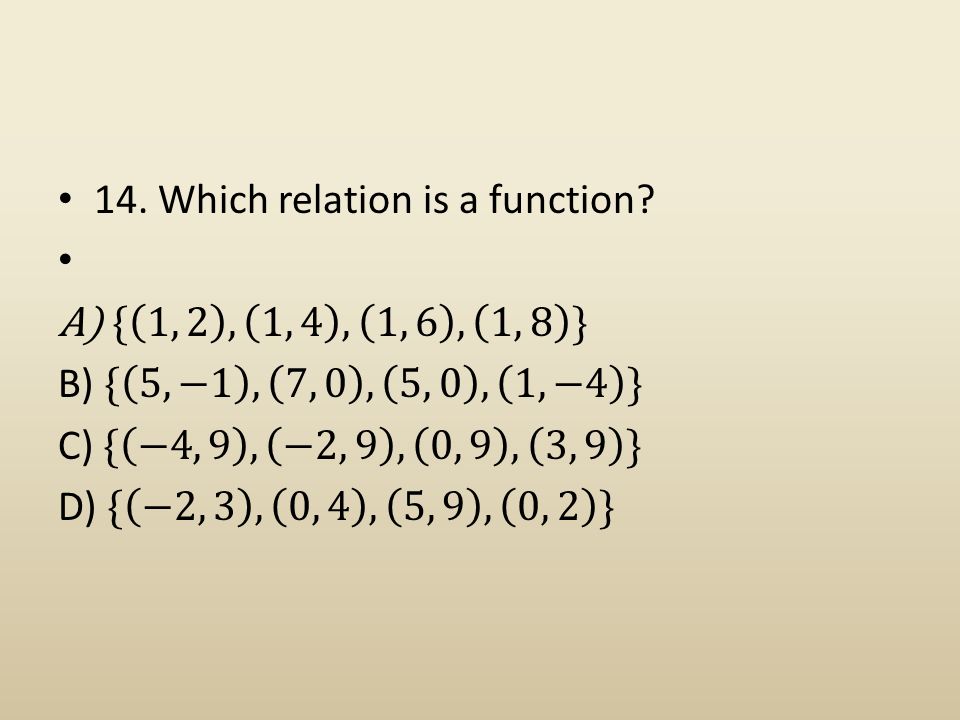
Algebra 1 Unit 1 test review

36
18. Which statement best describes the graph of the price of one share of a company’s stock shown at the right? A) The price increased more in the morning than in the afternoon. B) The price decreased more in the morning than in the afternoon. C) The price increased more in the afternoon than in the morning. D) The price decreased more in the afternoon than in the morning.
 The price increased more in the morning than in the afternoon. B) The price decreased more in the morning than in the afternoon. C) The price increased more in the afternoon than in the morning. D) The price decreased more in the afternoon than in the morning..")
50
25. According to the graph shown, approximately when will the price of gasoline reach $5 per gallon? A) 1987 B) 1992 C) 2012 D) the price won’t reach $5/gallon
 1987 B) 1992 C) 2012 D) the price won’t reach $5/gallon.")
Similar presentations


 is determined by the.>")


>")
