Download presentation
Presentation is loading. Please wait.

1
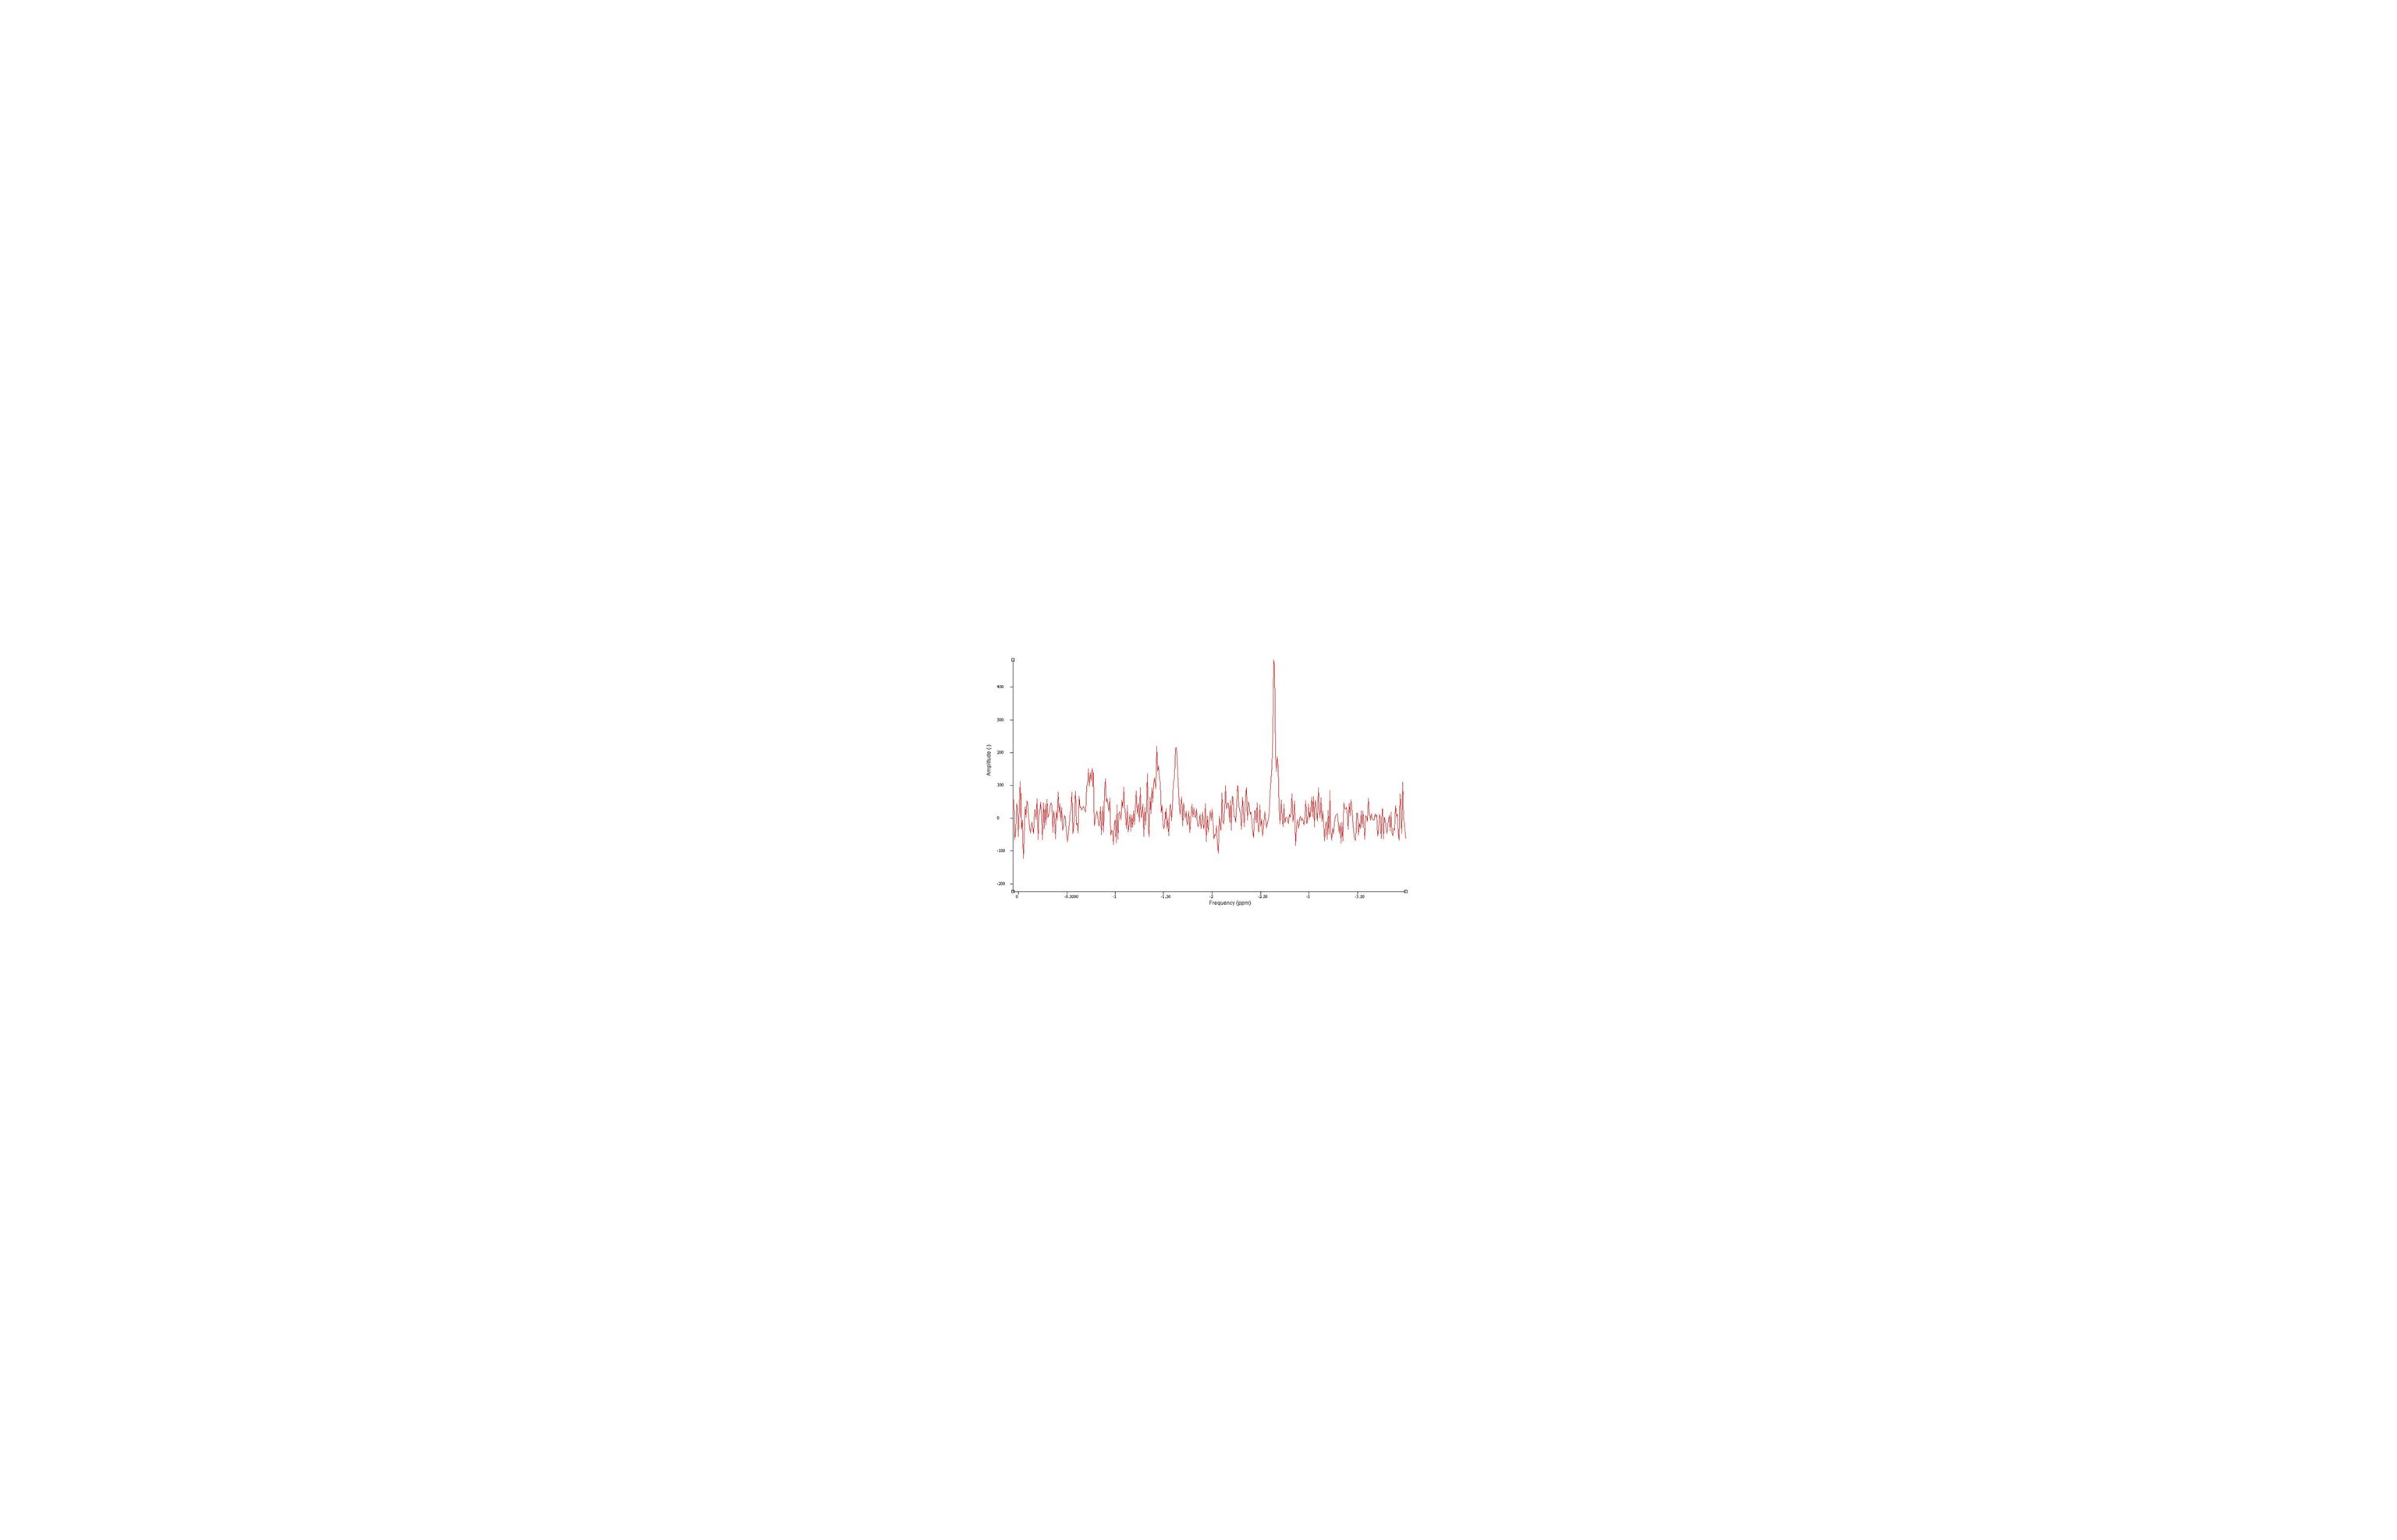
Spectroscopy of the Brain in Primary Lateral Sclerosis J. Taylor 4, D. Powell 2,3, H. Chebrolu, 1,3 A. Andersen 2,3, E. Kasarskis 1, C.D. Smith 1,2,3 1. Neurology, 2. Anatomy & Neurobiology, 3. UK MRISC, 4. UK Medical School, U. of Kentucky Med Ctr, Lexington, KY Abstract Primary lateral sclerosis is a degenerative disease causing loss of motor cells in the primary somatosensory and premotor cortex, and secondary degeneration of white matter within tracts projecting from these cortices. We studied nine patients diagnosed with primary lateral sclerosis (PLS) using Pringle criteria and compared them with eight normal subject controls. We sought to determine if the neuronal marker N-acetyl aspartate (NAA) was decreased globally in the grey matter or white matter of PLS patients. Methods: We used Chemical Shift Imaging to acquire multi-voxel proton magnetic resonance spectroscopy data on an axial brain slice immediately above the corpus callosum using a 15mm thick slice with an 8x8 grid comprised of 10x10mm voxels (Spin Echo, TE 135ms), incorporating both descending corticospinal tracts and premotor fibers. Segmentation of a T1- weighted slice corresponding to the spectroscopy volume was performed using FSL (cf. Figure 1). NAA peak area was normalized within each voxel spectrum to the creatine (Cr) peak area. Analysis. Least squares regression was performed on voxel fraction of grey matter to calculate predicted NAA in normal grey matter and white matter for each group. Separate estimates of grey and white matter NAA/Cr ratio were also made for each subject. We compared the group characteristics: age, Barthel index, Ashworth scale, strength and reflexes, and correlated age with NAA/Cr ratio. Results. There was no difference in age between groups (p = 0.13), and there was no significant correlation of age with NAA/Cr ratio (p = 0.31). Barthel disability index (p = 0.008), Ashworth spasticity scale (p = 0.01), strength (p = 0.01) and reflexes (p = 0.004) were different between groups (Wilcoxon test, corrected for multiple comparisons), as expected. Figure 1: Chemical shift imaging was used to obtain spectroscopy data in 64 voxels superior to the corpus callosum in each subject. T1 images were segmented using FSL. Gray matter to white matter ratio (grey matter fraction) was calculated for each voxel after removing the cerebrospinal fluid (CSF) contribution. CSF has negligible NAA and Cr, so does not contribute to the spectrum. Table 1: Profile of Controls and Patients with PLS Both controls and patients with PLS were subjected to an MMSE for analysis of their cognitive status, a Barthnell Index survey to quantify their level of functioning, and a neurological exam to demonstrate the variety in our PLS patient population. MMSE (Mini Mental Status Exam) range 0-30; Barthnell Index range 0-100; Ocular range full or LSM (loss of smooth pursuit); Reflexes range 4-0; Strength range 4-0; Ashworth scale of spasticity range 4-0; Gait spasticity range severe to absent and unable; Dysarthria range unintelligible to absent; Jaw jerk range increased to absent Axial Coronal Sagittal DTI Highlighting the CST (yellow). FMRI Depicting the CST Figure 2: Plot of NAA/Cr ratio as a function of grey matter fraction in each spectroscopy voxel for subjects by group. Red regression line represents data from 8 normal control subjects [c], blue line represents 9 PLS subjects [p]. The regression on grey matter fraction is significant (F = 190.3, p < 0.0001) and the group effect is significant (F = 23.8, p < 0.0001), indicating that the NAA/Cr ratio is globally greater in the normal control subjects, because the lines are nearly parallel (mean control 1.85 vs pls 1.76, a difference of 5%). Figure 3 (above): DTI (diffusion tensor imaging) will be used to evaluate the health of the CST and aid in locating the motor cortex for further spectroscopy analysis, by measuring fractional anisotropy along the tract. Conclusion: Our NAA:Cr ratio data supports the hypothesis that patients who suffer from PLS have a decreased amount of NAA in the whole brain compared to normal controls. This decrease in NAA is likely secondary to the neuronal degeneration in patients who have PLS. Figure 4 (left): FMRI (functional magnetic resonance imaging) will be used to evaluate strength of the BOLD response in the motor cortex during a finger tapping task. The response location will also aid in locating the motor cortex for fiber tracking and further spectroscopy analysis of the motor cortex. Future studies: (1) Determining if the decreased NAA:Cr ratio that is seen in the whole brain (Figure 2) is also evident when focusing only on the corticospinal tract. By superimposing the fMRI (Figure 4) and DTI (Figure 3) data onto the T1 weighted images, the motor cortex spectroscopy voxels can be identified and the NAA/Cr ratio can be determined and compared between PLS patients and controls. This will be an estimation of the neuronal and axonal degeneration causing PLS. (2) The BOLD fMRI signal (Figure 4) may also be analyzed to determine if there is a decrease in functional activation of the motor cortex in PLS patients compared to controls. (3) DTI fiber tractography (Figure 3) may be used to evaluate the health of the corticospinal tract in PLS versus normal controls. (4) If any of these studies show a significant difference between PLS and controls, a correlation between symptom severity (Table 1) and NAA or function will be evaluated. Table 1. Subject characteristics. Barthel index is a basic measure of disability on a 0-100 scale (100 is normal); Ashworth scale measures corticospinal tract dysfunction from normal of 4 to severe spasticity 0. Strength is rated from normal 4 to no movement 0. Normal reflexes are 2, with increases indicating corticospinal tract dysfunction (severe maximum of 4). Subject 16 had stroke, not PLS, therefore excluded from the analysis. T 1 Weighted Segmented Spec Voxels H 1 Spectrum from a typical white matter voxel NAA Cr
 using Pringle criteria and compared them with eight normal subject controls. We sought to determine if the neuronal marker N-acetyl aspartate (NAA) was decreased globally in the grey matter or white matter of PLS patients. Methods: We used Chemical Shift Imaging to acquire multi-voxel proton magnetic resonance spectroscopy data on an axial brain slice immediately above the corpus callosum using a 15mm thick slice with an 8x8 grid comprised of 10x10mm voxels (Spin Echo, TE 135ms), incorporating both descending corticospinal tracts and premotor fibers. Segmentation of a T1- weighted slice corresponding to the spectroscopy volume was performed using FSL (cf. Figure 1). NAA peak area was normalized within each voxel spectrum to the creatine (Cr) peak area. Analysis. Least squares regression was performed on voxel fraction of grey matter to calculate predicted NAA in normal grey matter and white matter for each group. Separate estimates of grey and white matter NAA/Cr ratio were also made for each subject. We compared the group characteristics: age, Barthel index, Ashworth scale, strength and reflexes, and correlated age with NAA/Cr ratio. Results. There was no difference in age between groups (p = 0.13), and there was no significant correlation of age with NAA/Cr ratio (p = 0.31). Barthel disability index (p = 0.008), Ashworth spasticity scale (p = 0.01), strength (p = 0.01) and reflexes (p = 0.004) were different between groups (Wilcoxon test, corrected for multiple comparisons), as expected. Figure 1: Chemical shift imaging was used to obtain spectroscopy data in 64 voxels superior to the corpus callosum in each subject. T1 images were segmented using FSL. Gray matter to white matter ratio (grey matter fraction) was calculated for each voxel after removing the cerebrospinal fluid (CSF) contribution. CSF has negligible NAA and Cr, so does not contribute to the spectrum. Table 1: Profile of Controls and Patients with PLS Both controls and patients with PLS were subjected to an MMSE for analysis of their cognitive status, a Barthnell Index survey to quantify their level of functioning, and a neurological exam to demonstrate the variety in our PLS patient population. MMSE (Mini Mental Status Exam) range 0-30; Barthnell Index range 0-100; Ocular range full or LSM (loss of smooth pursuit); Reflexes range 4-0; Strength range 4-0; Ashworth scale of spasticity range 4-0; Gait spasticity range severe to absent and unable; Dysarthria range unintelligible to absent; Jaw jerk range increased to absent Axial Coronal Sagittal DTI Highlighting the CST (yellow). FMRI Depicting the CST Figure 2: Plot of NAA/Cr ratio as a function of grey matter fraction in each spectroscopy voxel for subjects by group. Red regression line represents data from 8 normal control subjects [c], blue line represents 9 PLS subjects [p]. The regression on grey matter fraction is significant (F = 190.3, p < ) and the group effect is significant (F = 23.8, p < ), indicating that the NAA/Cr ratio is globally greater in the normal control subjects, because the lines are nearly parallel (mean control 1.85 vs pls 1.76, a difference of 5%). Figure 3 (above): DTI (diffusion tensor imaging) will be used to evaluate the health of the CST and aid in locating the motor cortex for further spectroscopy analysis, by measuring fractional anisotropy along the tract. Conclusion: Our NAA:Cr ratio data supports the hypothesis that patients who suffer from PLS have a decreased amount of NAA in the whole brain compared to normal controls. This decrease in NAA is likely secondary to the neuronal degeneration in patients who have PLS. Figure 4 (left): FMRI (functional magnetic resonance imaging) will be used to evaluate strength of the BOLD response in the motor cortex during a finger tapping task. The response location will also aid in locating the motor cortex for fiber tracking and further spectroscopy analysis of the motor cortex. Future studies: (1) Determining if the decreased NAA:Cr ratio that is seen in the whole brain (Figure 2) is also evident when focusing only on the corticospinal tract. By superimposing the fMRI (Figure 4) and DTI (Figure 3) data onto the T1 weighted images, the motor cortex spectroscopy voxels can be identified and the NAA/Cr ratio can be determined and compared between PLS patients and controls. This will be an estimation of the neuronal and axonal degeneration causing PLS. (2) The BOLD fMRI signal (Figure 4) may also be analyzed to determine if there is a decrease in functional activation of the motor cortex in PLS patients compared to controls. (3) DTI fiber tractography (Figure 3) may be used to evaluate the health of the corticospinal tract in PLS versus normal controls. (4) If any of these studies show a significant difference between PLS and controls, a correlation between symptom severity (Table 1) and NAA or function will be evaluated. Table 1. Subject characteristics. Barthel index is a basic measure of disability on a scale (100 is normal); Ashworth scale measures corticospinal tract dysfunction from normal of 4 to severe spasticity 0. Strength is rated from normal 4 to no movement 0. Normal reflexes are 2, with increases indicating corticospinal tract dysfunction (severe maximum of 4). Subject 16 had stroke, not PLS, therefore excluded from the analysis. T 1 Weighted Segmented Spec Voxels H 1 Spectrum from a typical white matter voxel NAA Cr.")
2
MPRAGE Segmented Spectroscopy

3
Axial Coronal Sagittal

Similar presentations


 (MND) are a group of neurological disorders that selectively affect motor neurons.>")


![References: [1]S.M. Smith et al. (2004) Advances in functional and structural MR image analysis and implementation in FSL. Neuroimage 23:208-219 [2]S.M.](/34/8291718/big_thumb.jpg "References: [1]S.M. Smith et al. (2004) Advances in functional and structural MR image analysis and implementation in FSL. Neuroimage 23:208-219 [2]S.M.>")

.>")
