Download presentation
Presentation is loading. Please wait.

1
Kevin Kline Director of Engineering Services, SQL Sentry SQL Server MVP since 2003 Twitter, FB, LI, KEKline Blog: http://KevinEKline.com, http://ForITPros.comhttp://KevinEKline.comhttp://ForITPros.com

2
Tuning blog: http://www.sqlperformance.com/http://www.sqlperformance.com/ E-mail ebooks@sqlsentry.com for free copies of our e-books:ebooks@sqlsentry.com

3
Methodology for troubleshooting Troubleshooting tools and techniques using the native SQL Server tool kit: o Wait Stats o Windows Performance Monitor (PerfMon) o SQL Profiler, Server-Side Traces, and XEvents o SQL Server DMVs o Execution Plans Summary, Resources, and Q&A
 o SQL Profiler, Server-Side Traces, and XEvents o SQL Server DMVs o Execution Plans Summary, Resources, and Q&A")
4
There’s not a “right” or “wrong” place to start. You can start at any of the points shown above. Start with the information source that provides the actionable information most quickly Error Logs PerfMon DMVs Profiler & Trace SSMS (Execution Plan)
.")
5
Effective troubleshooting is like a funnel or series of continuously more refined sieves. Each successive sieve filters out smaller “chunks”; that is, harder and more transient errors and problems More work is required… Identification & Resolution Specific SQL Cmds Resource issues Errors in the log

6
Shortcut! Has anything changed? Inside or outside of SQL Server? Is the issue caused by a SQL Server error? Are there excessive wait stats? Correlate wait stats against other metrics. Follow-up 1. 2. 3. 4. 5. 6.

7
Your best shortcut? Know what has changed! Sp_Configure or sys.configurations Sp_Dboption (pre-SQL2012) or sys.databases (SQL2012 +) DDL triggers for meta-data changes: o Developers? o Unfettered access to databases? Remember: Change = Risk
 or sys.databases (SQL2012 +) DDL triggers for meta-data changes: o Developers. o Unfettered access to databases. Remember: Change = Risk.")
8
Windows Application helps eliminate non-SQL Server problems SQL Server Error Log and SQL Server Agent Log o Available both as TXT and through the GUI o SQL Server keeps the six most recent, incrementing with each reboot WARNING! Always make sure to enable SQL Server Agent notifications for severity level 18 or greater!

9
No further research required o Error found with easy fix o Error found with difficult fix or restore required Further research required o Error found, but time or symptoms of error do not correlate to the problem o No error found

10
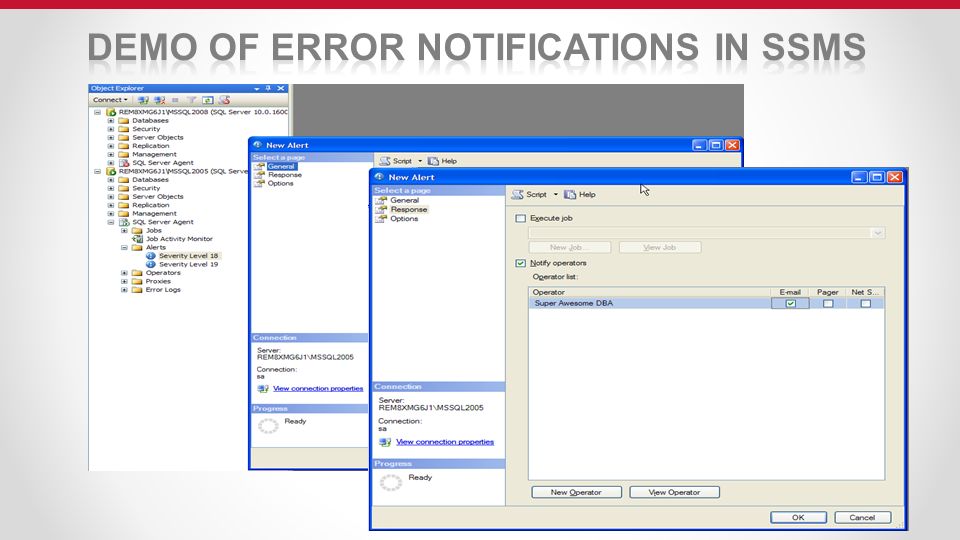
Error Notification

12
Error notification can be difficult with lots of SQL Servers. Ease the pain by setting up Event Forwarding under the Advanced properties of the SQL Server Agent. All events from remote servers are forwarded to one (or more) central servers. Now, only one instance of SQLMail/DBMail are needed in your environment.
 central servers. Now, only one instance of SQLMail/DBMail are needed in your environment..")
13
We retrieved the top level information, “the big rocks” Now, what’s the best way to go deeper?

14
Anytime a task in SQL Server waits for something: o It is reported as a wait type o Reveals where the bottlenecks are SQL Server 2005 aggregates wait type information SQL Server 2008 provides new pre-emptive wait stats

15
1 Window = 1 Scheduler Users are assigned to a thread Uh oh! The out of soda! No problem. Step aside… More syrup for the sodas! Goes to the waiting or “suspended” queue Yeah! I’m next in line!

16
sys.dm_os_waiting_tasks Wait information Task level Very accurate Transient data

17
PAGELATCH_xx and LATCH_xx PAGEIOLATCH_xx usually come from contention on the buffer pool LATCH_xx commonly arise from contention on resources other than buffer pool, especially due to heaps or text data types LCK_xx arise from lots of locks and blocks, perhaps by overlong transactions or improperly indexed tables or poorly configured hardware

18
SOS_SCHEDULER_YIELD Yielding processor time CXPACKET Query parallelism due to splitting and merging overhead

19
WRITELOG Writing transactions to the log on disk PAGEIOLATCH_xx Represent memory-to-disk transfers IO_COMPLETION Awaiting I/O task completion

20
OLEDB Wait on the OLEDB provider o Full-Text Search o Lots of linked servers NETWORKIO Often poor client response, in addition to physical networking

21
SLEEP_BPOOL_FLUSH Checkpoint IO throttling RESOURCE_SEMAPHORE_QUERY_CO MPILE Throttling query compilations Compilations, re-compilations, non- cacheable plans RESOURCE_SEMAPHORE Waiting for a memory grant

22
WAITFOR T-SQL WAITFOR command SQLTRACE_BUFFER_FLUSH Default trace LAZYWRITER_SLEEP System process waiting to start

23
CPU PRESSURE CPU pressure: SOS_SCHEDULER_YIELD Parallelism: CXPACKET LOCKING Long term blocking: LCK_X, LCK_M_U, & LCK_M_X MEMORY Buffer latch: PAGELATCH_X Non-buffer latch: LATCH_X Memory grants: RESOURCE_SEMAPHORE I/O Buffer I/O latch: PAGEIOLATCH_X Tran log disk subsystem: WRITELOG & LOGBUFFER General I/O issues: ASYNC_IO_COMPLETION & IO_COMPLETION NETWORK PRESSURE Network I/O: ASYNC_NETWORK_IO

24
With wait stats, other older standbys are not as frequently needed. o But they still help! PerfMon Xevents and Traces (either Profiler or Server-side) DMVs
 DMVs.")
25
Benefits: Shows the rate of resource consumption or activity in a wide variety of areas on the server, for example o Disk IO; Memory; Network o SQL Server activity - Locking, Blocking, and Deadlocking; Cache Activity; Object Utilization Limitations o Very hard to know what to track and what values indicate good or bad performance o Doesn’t offer good root-cause analysis, only resource consumption info

27
ObjectCounterValueNotesPaging$Usage<70% Amount of page file currently in use Processor % Processor Time <= 80% The higher it is, the more likely users are delayed. Processor % Privilege Time <30% of % Processor Time Amount of time spent executing kernel commands like SQL Server IO requests. Process(sqlservr) Process (msmdsrv) % Processor Time < 80% Percentage of elapsed time spent on SQL Server and Analysis Server process threads. System Processor Queue Length < 4 < 12 per CPU is good/fair, < 8 is better, < 4 is best
 Process (msmdsrv) % Processor Time < 80% Percentage of elapsed time spent on SQL Server and Analysis Server process threads. System Processor Queue Length < 4 < 12 per CPU is good/fair, < 8 is better, < 4 is best.")
28
ObjectCounterValueNotes Physical Disk Avg Disk Reads/sec < 8 > 20 is poor, 20 is poor, <20 is good/fair, <12 is better, <8 is best Physical Disk Avg Disk Writes/sec < 8 or <1 Without cache: > 20 poor, 20 poor, <20 fair, <12 better, <8 best. With cache > 4 poor, 4 poor, <4 fair, <2 better, <1 best Memory Available Mbytes >100 Amount of physical memory available to run processes on the machine SQL Server: Memory Manager Memory Grants Pending ~0 Current number of processes waiting for a workspace memory grant. SQL Server: Buffer Manager Free List Stalls/sec < 2 Frequency that requests for db buffer pages are suspended because there are no buffers.

29
ObjectCounterValueNotes :Access Methods Forwarded Records/sec <10* Tables with records traversed by a pointer. Should be < 10 per 100 batch requests/sec. :Access Methods Page Splits/sec <20* Number of 8k pages that filled and split into two new pages. Should be <20 per 100 batch requests/sec. :Databases Log Growths/sec; Percent Log used < 1 and <80%, resp Don’t let transaction log growth happen randomly! :SQL Statistics Batch Requests/sec * No firm number without benchmarking, but > 1000 is a very busy system. :SQL Statistics Compilations/sec;Reco mpilations/sec * Compilations should be <10% of batch requests/sec; Recompilations should be <10% of compilations/sec :LocksDeadlocks/sec < 1 Nbr of lock requests that caused a deadlock.

30
Monitors SQL Server for the occurrence of events When an event fires, Profiler logs the event and information about it Useful for: o Finding and diagnosing slow-running code. o Capturing the series of SQL statements that lead to a problem o Replaying and reproducing a problem on a test machine Doesn’t offer resource consumption info, just granular details

31
Warning! Profiler can be overwhelmed by a high throughput system! Server-side traces happen entirely on the server (no client GUI) and are controlled using stored procedures Useful for “auto-start” logging and high performance scenarios TIP! Profiler can be used to create a server-side trace. That means no procedures to learn.
 and are controlled using stored procedures Useful for auto-start logging and high performance scenarios TIP. Profiler can be used to create a server-side trace. That means no procedures to learn..")
32
Correlating PerfMon and Profiler Information

33
1: Invoke SQL Profiler 2: Choose a template, Standard is usually ok. 3: Choose your Events from the Events Selection tab. 4: Click RUN to begin the trace. 5: Click STOP to end the trace and write it to a file.

34
1.After collecting a PerfMon and Profiler trace file, load the Profiler file using File Open Trace File. 2.Choose File Import Performance Data to load in the PerfMon trace file. 3.Choose the PerfMon counters to show on your analysis screen. 4.You’ll then have the overlay of PerfMon & Profiler data as shown on the right. 5.You can click anywhere on the timeline to see what was happening at that point in time.

35
Tell exactly what’s happening at present inside of SQL Server Multitude of DMVs, which can tell things like: o What are the top 10 most CPU-intensive queries? o What are the 5 biggest objects in cache? o Which objects get the most IO? o Which users consume the most resources? DBCC SQLPERF ('sys.dm_os_wait_stats', CLEAR);
;.")
36
Performance & Wait Stats Sys.dm_os_wait_stats Sys.dm_os_performance_counters Sys.dm_os_waiting_tasks I/O Sys.dm_io_virtual_file_stats Sys.dm_io_pending_io_requests Transactions Sys.dm_tran_lock Sys.dm_db_index_operational_stats Sys.dm_db_index_usage_stats SPID Activity & SQL Statements Sys.dm_os_exec_requests Sys.dm_exec_requests Sys.dm_exec_query_stats Sys.dm_exec{procedure | trigger}_stats Why code it yourself? Get Glenn Berry’s latest scripts at http://sqlserverperformance.wordpress.com/category/diagnostic-queries/

37
1. Inside or Outside of MSSQL? Check Windows Server logs. Resolve any errors and recheck. 2. Caused by an MSSQL or SQLAgent error? Check SQL Server and SQL Agent logs. Resolve any errors and recheck. 3. Excessive wait stats? Assess wait statistics to categorize the bottleneck using sys.dm_wait_stats. 4. Wait stats correlate to specific sessions or components? Assess session wait stats using sys.dm_waiting_tasks. Resolve problematic user activity or process. Assess other problem areas using other DMVs, like dm.os_performance_counters. Resolve system misconfiguration, design problem, or resource shortage.

38
Once the root-problem is revealed, you still have to fix it. Common resolutions using SSMS include: o Debug a SQL Server procedure or function o Tune one or more SQL statements o Add or alter indexes Tuning SQL code can be difficult unless you know how to read an execution plan: o SQL Sentry Plan Explorer is FREE!

39
Explain plans tell you all the internal steps that the SQL Server takes to complete the action Read graphic explain plans from right to left. (Textual ones from bottom to top) Graphic plans use icons to represent actions, while arrows represent data flows
 Graphic plans use icons to represent actions, while arrows represent data flows.")
40
Reading Basic Execution Plans

42
Fixing bad code is an exercise in experimentation o Lots of tips & tricks to try o Check out our tuning content at http://sqlsentry.tvhttp://sqlsentry.tv Figure out the work done in the code, then try a new version that might improve it: o Different search arguments in the WHERE or JOIN clauses to make better use of indexes o Use an alternative pattern o Apply a different locking strategy o Use a query hint Clear you caches, then rewrite, test, repeat…

43
When using the native tools in SQL Server to detect, diagnose, and resolve problems, you must use: The SQL Server Error Log The SQL Server Error Log Wait Stats Wait Stats PerfMon PerfMon SQL Profiler and/or server-side traces SQL Profiler and/or server-side traces DMVs (sometimes, the Perf Dashboard) DMVs (sometimes, the Perf Dashboard) Asses execution plans Asses execution plans
 DMVs (sometimes, the Perf Dashboard) Asses execution plans Asses execution plans")
44
Adam Machanic’s sp_whoisactive Brent Ozar’s sp_askBrent, sp_blitz Extended events – Jonathan Kehayias DMVs – Glenn Berry’s diagnostic queries System info: dm_os_performance_counters, dm_os_wait_stats Query info: dm_exec_requests, dm_exec_query_stats Plans: dm_exec_query_plan, dm_exec_plan_attributes Cache/buffer pool: dm_exec_cached_plans, dm_os_buffer_descriptors Index info: dm_db_index_usage_stats, dm_io_virtual_file_stats

45
Slides will be available at http://sqlsentry.com/AaronBertrandhttp://sqlsentry.com/AaronBertrand o Password is $entry E-mail ebooks@sqlsentry.com for free copies of our e-books:ebooks@sqlsentry.com o Just tell them where you met me

Similar presentations


 Chapter 14 Server and Network Monitoring.>")


