Download presentation
Presentation is loading. Please wait.

1
www.biointeractive.org Data Point: Using Primary Literature to Teach Data Literacy What does it say? What does it mean?

2
Look at this graph. What do you see? What does it mean? www.biointeractive.org

3
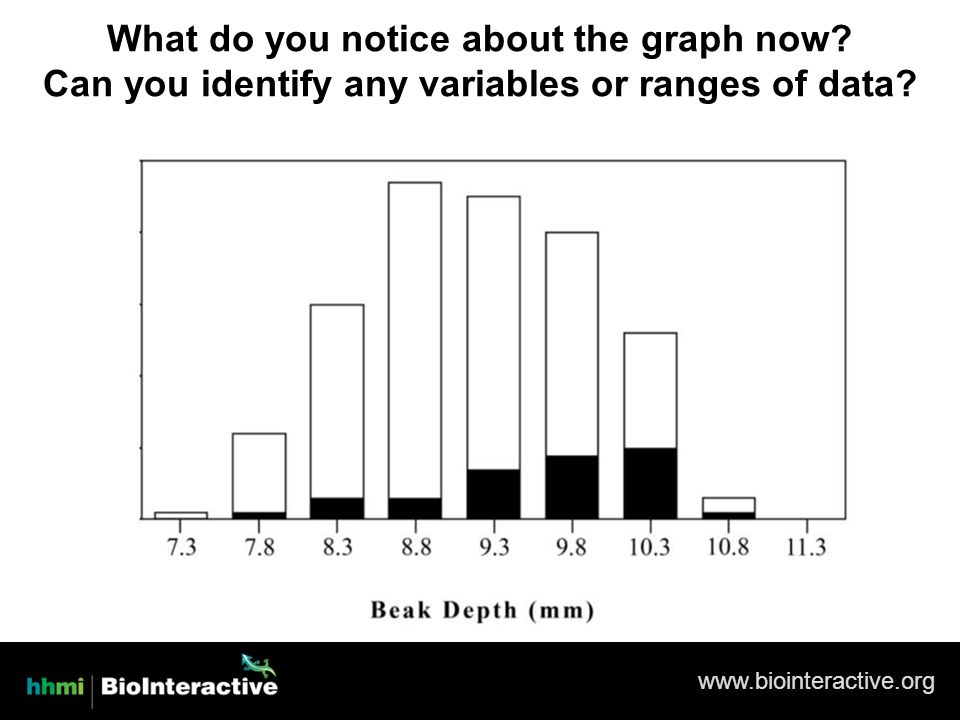
What do you notice about the graph now? Can you identify any variables or ranges of data? www.biointeractive.org
4
What do you notice about the graph now? Can you identify any variables or type of graph? www.biointeractive.org

5
What do you notice about the graph now? Do you know anything new? www.biointeractive.org

6
Read the figure caption. Do you know anything new? www.biointeractive.org

7
Read the background information. Do you know anything new? www.biointeractive.org BACKGROUND INFORMATION Rosemary and Peter Grant performed a series of long-term studies on the finches on the island of Daphne Major in the Galápagos Islands. With its short, blunt beak, the medium ground finch (Geospiza fortis) is adapted to picking up seeds from the ground. In 1976, seeds on the island were diverse and plentiful. However, during a drought in 1977, seeds became more scarce. Once the finches had eaten all the small and medium-sized seeds, they had to turn to larger, spiny seeds that are hard to crack open. The graph above shows the distribution of beak depths of the finch population before the drought (white bars) and after the drought (black bars).
 is adapted to picking up seeds from the ground. In 1976, seeds on the island were diverse and plentiful. However, during a drought in 1977, seeds became more scarce. Once the finches had eaten all the small and medium-sized seeds, they had to turn to larger, spiny seeds that are hard to crack open. The graph above shows the distribution of beak depths of the finch population before the drought (white bars) and after the drought (black bars)..")
8
1.How has the medium ground finch population changed after the drought? 2.Why do you think the Grants wanted to look at beak depth before and after the drought? 3.If the finches that survived reproduced, predict what the distribution of beak depths of the offspring would look like. How would this compare to the beak depth of the offspring hatched before the drought? Discussion Questions www.biointeractive.org

9
Based on your predictions to the last discussion question, look at these graphs and compare the offspring from 1976 to offspring from 1978. What do you see? What does it mean? www.biointeractive.org Beak Depth (mm) Number of Birds Caption: Distributions of beak depths of fully grown offspring hatched in 1976 and 1978 respectively.
 Number of Birds Caption: Distributions of beak depths of fully grown offspring hatched in 1976 and 1978 respectively..")
Similar presentations


? –“It occurred to me to ask the question, why do some die and some live. – And the answer.>")
. Common Fallacies about Evolution Progressivism Fallacy Teleology Fallacy (Purposivism Fallacy) >")


 clothespin.>")


![Darwin’s 4 Postulates of the Theory of Evolution by Natural Selection part 1 [15.3] SPI 2 Recognize the relationship between form and function in living.](/24/7372551/big_thumb.jpg "Darwin’s 4 Postulates of the Theory of Evolution by Natural Selection part 1 [15.3] SPI 2 Recognize the relationship between form and function in living.>")
