Download presentation
Presentation is loading. Please wait.

1
Minimal Recombinations Histories and Global Pedigrees Finding Minimal Recombination Histories Acknowledgements Yun Song - Rune Lyngsø - Mike Steel - Carsten Wiuf Global Pedigrees 1 23 4 1 23 4 1 2 3 4

2
Basic Evolutionary Events Recombination Gene Conversion Coalescent/Duplication Mutation

3
Time slices Population N 1 1 2 Time All positions have found a common ancestors All positions have found a common ancestors on one sequence

4
Recombination-Coalescence Illustration Copied from Hudson 1991 Intensities Coales. Recomb. 1 2 3 2 6 2 3 (2+b) 1 (1+b) 0 b
 1 (1+b) 0 b.")
5
Encoding, Phylogenies and Incompatibility 00001110000111 1 C 2 C 3 C 4 C 5 A 6 A 7 A 00001110000111 1 mutation per site 0 0: 1: 1 1,2,3,4 5,6,7 00011010001101 00 10 01 11 Four combinations Incompatibility:

6
The 1983 Kreitman Data & the infinite site assumption (M. Kreitman 1983 Nature) Recoded Kreitman data i. (0,1) ancestor state known ii. Multiple copies represented by 1 sequence iii. Non-informative sites could be removed 11 sequences of alcohol dehydrogenase gene in Drosophila melanogaster. Can be reduced to 9 sequences (3 of 11 are identical). 3200 bp long, 43 segregating sites, 28 of which are informative
 Recoded Kreitman data i. (0,1) ancestor state known ii. Multiple copies represented by 1 sequence iii. Non-informative sites could be removed 11 sequences of alcohol dehydrogenase gene in Drosophila melanogaster. Can be reduced to 9 sequences (3 of 11 are identical) bp long, 43 segregating sites, 28 of which are informative.")
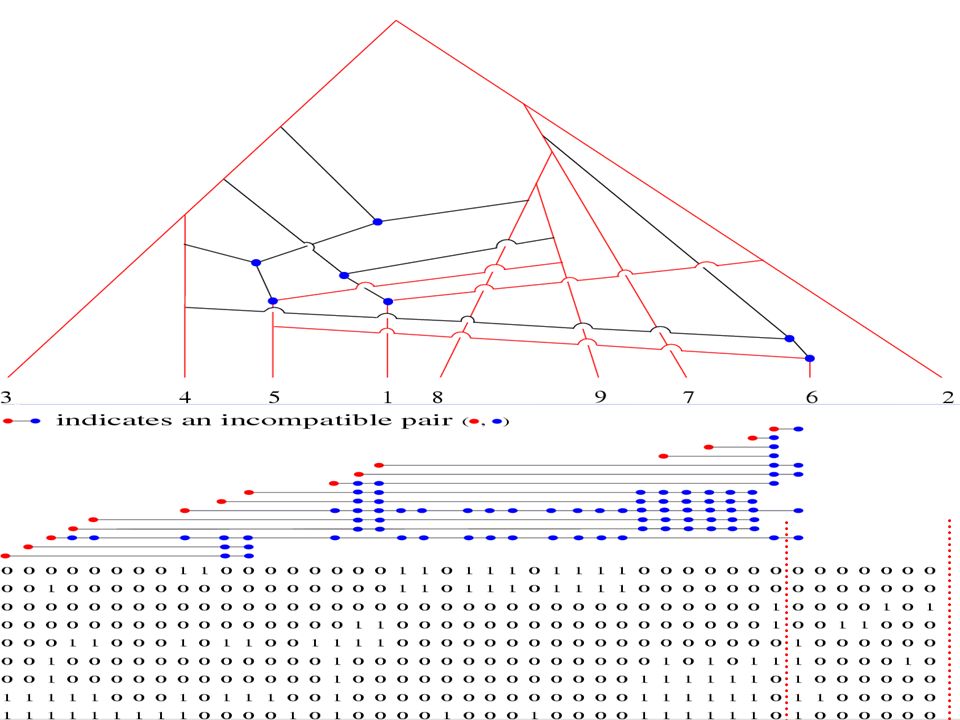
7
Hudson & Kaplan’s R M If you equate R M with expected number of recombinations, this could be used as an estimator. Unfortunately, R M is a gross underestimate of the real number of recombinations. 0 0 0 0 0 1 0 0 0 0 0 1 1 1 1 1 1 1 1 1 0 0 0 0 0 0 0 0 0 0 1 0 0 0 0 0 0 0 0 1 1 1 1 1 1 1 1 1 0 0 0 0 0 0 0 0 0 0 0 0 0 0 0 0 0 0 0 0 0 0 0 0 0 0 0 0 0 0 0 0 0 0 1 0 0 0 0 0 0 0 0 0 0 1 1 0 0 0 0 0 0 0 0 0 0 0 0 0 0 0 1 0 0 0 0 1 1 1 1 1 1 1 1 0 0 0 0 0 0 0 0 0 0 0 0 0 0 0 0 1 0 0 1 0 0 0 0 0 1 0 0 0 0 0 0 0 0 0 0 0 0 1 0 1 0 1 1 1 0 0 1 0 0 0 0 0 1 0 0 0 0 0 0 0 0 0 0 0 1 1 1 1 1 1 0 1 1 1 1 1 1 1 1 1 1 0 0 0 0 0 0 0 0 0 0 0 1 1 1 1 1 1 0 1 1 1 1 1 1 1 0 0 1 0 0 0 0 0 0 0 0 0 0 0 1 1 1 1 1 1 0 1

8
Recombination Parsimony Hein, 1990,93 & Song & Hein, 2002+ 1 2 3 T i-1iL 21 Data Trees

9
Metrics on Trees based on subtree transfers. Trees including branch lengths Unrooted tree topologies Rooted tree topologies Tree topologies with age ordered internal nodes Pretending the easy problem (unrooted) is the real problem (age ordered), causes violation of the triangle inequality:
 is the real problem (age ordered), causes violation of the triangle inequality:.")
10
Observe that the size of the unit-neighbourhood of a tree does not grow nearly as fast as the number of trees Allen & Steel (2001) Song (2003+) Due to Yun Song Tree Combinatorics and Neighborhoods
 Song (2003+) Due to Yun Song Tree Combinatorics and Neighborhoods")
11
1

12
2

13
3

14
4

15
5 6

16
7

18
Branch and Bound Algorithm 1. The number of ancestral sequences in the ACs. 2. Number of ancestral sequences in the ACs for neighbor pairs 3. AC compatible with the minimal ARG. 4. AC compatible with close-to-minimal ARG. ? Exact length Lower bound Upper Bound 0 3 1 91 2 1314 3 8618 4 30436 5 62794 6 78970 7 63049 8 32451 9 10467 10 1727 289920 k-recombinatination neighborhood k

19
Methods # of rec events obtained Hudson & Kaplan (1985)5 Myers & Griffiths (2003)6 Song & Hein (2004). Set theory based approach.7 Song & Hein (2003). Current program using rooted trees. Lyngsø, Song & Hein (2006). Massive Acceleration using Branch and Bound Algorithm. Lyngsø, Song & Hein (2006). Minimal number of Gene Conversions (in prep.) 7 5-2 The Minimal Recombination History for the Kreitman Data
. Current program using rooted trees. Lyngsø, Song & Hein (2006). Massive Acceleration using Branch and Bound Algorithm. Lyngsø, Song & Hein (2006). Minimal number of Gene Conversions (in prep.) The Minimal Recombination History for the Kreitman Data.")
20
Spatial Coalescent-Recombination Algorithm (Wiuf & Hein 1999 TPB) Temporal Process Spatial Process i. The process is non-Markovian ii. The trees cannot be reduced to Topologies * * =

21
Gene Conversions & Treeness Recombination Gene Conversion Coalescent:Star tree:

22
The Bad News: Actual, potentially detectable and detected recombinations Leaves Root Edge-Length Topo-Diff Tree-Diff 2 1.0 2.0 0.0.666 3 1.33 3.0 0.0.694 4 1.50 3.66 0.073.714 5 1.60 4.16 0.134.728 6 1.66 4.57 0.183.740 10 1.80 5.66 0.300.769 15 1.87 6.50 0.374.790 500 1.99 0.670 1 23 4 1 23 4 True ARG Minimal ARG 0 4 Mb

23
The Good News: Quality of the estimated local tree True ARG Reconstructed ARG 1 23 45 123 45 ((1,2),(1,2,3)) ((1,3),(1,2,3)) n=7 =10 =75
,(1,2,3)) ((1,3),(1,2,3)) n=7 =10 =75")
24
Simultaneous Inference of Haplotypes & Recombination Events Combinatorial Optimization Version Data: Genotypes/SNPs: C G A G ? ? ? ? ? ? ? ? C,G A,G ?,? ?? ?,? 1: 2: 3: 1.1 1.2 2.1 2.2 3.1 2.2 Gusfield, 2002 Rahman/Lyngsø (unpubl.): Heuristic Sequence of Phylogenies Song et al., 2006
: Heuristic Sequence of Phylogenies Song et al.,")
25
The Griffiths-Ethier-Tavare Recursions 0 1 2 3 4 5 6 7 8 1 1 4 2 5 3 1 5 5 No recombination: Infinite Site Assumption Ancestral State Known History Graph: Recursions Exists No cycles - recombination 27 ACs + recombination 3*10 8 ACs Possible Histories without Recombination for simple data example

26
Ancestral configurations to 2 sequences with 2 segregating sites: k1k1 k2k2 (k 2 +1)*k 1 +1 possible ancestral columns.
*k 1 +1 possible ancestral columns.")
27
Counting Recursion + 1k+1 k k 1 (k 2 +1)+1 padded with “-” Summary statistic lumping configurations
+1 padded with - Summary statistic lumping configurations")
28
Enumeration of Ancestral States (via counting restricted non-negative integer matrices with given row and column sums) Due to Yun Song +
 Due to Yun Song +")
29
Examples of Likelihood Calculations 010 101 110 R=1R=2 R=3

30
Time slices Population N 1 1 2 Time All positions have found a common ancestors All positions have found a common ancestors on one sequence

31
S – number of Segments E(S ) = 1 + Number of genetic ancestors to the Human Genome sequence time R R R C C C Statements about number of ancestors are much harder to make. Simulations

32
A randomly picked ancestor: (ancestral material comes in batteries!) 0 0 52.000 260 Mb 0 6890 8360 7.5 Mb *35 0 30kb *250 Parameters used 4N e 20.000 Chromos. 1: 263 Mb. 263 cM Chromosome 1: Segments 52.000 Ancestors 6.800 All chromosomes Ancestors 86.000 Physical Population. 1.3-5.0 Mill. Applications to Human Genome (Wiuf and Hein,97)
.")
33
1. Simultaneous Events 2. Multifurcations. 3. Underestimation of Coalescent Rates Multiple and Simultaneous Coalescents

34
Recombination Induced Multiple Coalescent Events High recombination rate will create many ancestors violating the coalescent assumption that sample size << 2N 2N=10.000, sample size (10, 200, 3000, 8000) 1 P(X 2 > 1) = (2N-1)/2N = 1-(1/2N)
 1 P(X 2 > 1) = (2N-1)/2N = 1-(1/2N)")
35
Recombination Induced Multiple Coalescent Events Recombination Recombination + Gene Conversion Number of our genetic ancestors Recombination Carriers Gene Conversion Carriers Gene Conversion: Length 300, G=[R,100R] Recombination Carriers + Gene Conversion Carriers + Mixed
![Recombination Induced Multiple Coalescent Events Recombination Recombination + Gene Conversion Number of our genetic ancestors Recombination Carriers Gene Conversion Carriers Gene Conversion: Length 300, G=[R,100R] Recombination Carriers + Gene Conversion Carriers + Mixed](http://images.slideplayer.com/36/10598665/slides/slide_35.jpg "Recombination Induced Multiple Coalescent Events Recombination Recombination + Gene Conversion Number of our genetic ancestors Recombination Carriers Gene Conversion Carriers Gene Conversion: Length 300, G=[R,100R] Recombination Carriers + Gene Conversion Carriers + Mixed")
36
Recombination Induced Multiple Coalescent Events Consequences for Recombination-Coalescent Process: Globally Wrong, Locally Correct. Coalescent Rate: Discrete versus Continuous Coalescent Rate: Discrete versus Continuous

37
Questions based on Large Data Sets Much much more sequence data 1.Comparative Genomics of a Huge Scale 2.Population Genomics One issue: reconstructing population pedigrees. Extreme data: Identifiability of pedigrees 3.”Association Mapping” on the Tree of Life 4. Somatic Gene Genealogies and the Models of Embryology

38
Global Pedigrees 1. Wiuf & Hein (1999) 'A contribution to the discussion of J. Chang's paper "Recent Common Ancestor of All Present Human Individuals" ' ( Adv. Appl. Prob. vol. 31.4) 2. Hein (2004) "Pedigrees for all Humanity" Nature 431.512-13. 3.Steel and Hein (2005) “Reconstructing Pedigrees: A combinatorial perspective. J.Theor. Biol. 99 Chang and Derrida. Time to a universal common ancestor 04 Rhode tries to answer this for realistic population model Combining the Coalescent and Pedigree Process Super-pedigree problem Bound on how much data is needed to infer a pedigree Does embedded phylogenies determined the pedigree
 2. Hein (2004) Pedigrees for all Humanity Nature Steel and Hein (2005) Reconstructing Pedigrees: A combinatorial perspective. J.Theor. Biol. 99 Chang and Derrida. Time to a universal common ancestor 04 Rhode tries to answer this for realistic population model Combining the Coalescent and Pedigree Process Super-pedigree problem Bound on how much data is needed to infer a pedigree Does embedded phylogenies determined the pedigree.")
39
Combining Ancestral Individuals and the Coalescent Wiuf & Hein, 2000. Let T be the time, when somebody was everybody’s ancestor. Changs’ result: lim T*/log 2 (N) =1 prob. 1 Unify the two processes: I. Sample more individuals II. Let each have 2 parents with probabilty p. Result: A discontinuity at 1. For p<1 change log 2 log p Comment: Genetic Ancestors is a vanishing set within Genealogical Ancestors.
 =1 prob. 1 Unify the two processes: I. Sample more individuals II. Let each have 2 parents with probabilty p. Result: A discontinuity at 1. For p<1 change log 2 log p Comment: Genetic Ancestors is a vanishing set within Genealogical Ancestors..")
40
Pedigree Ancestors and Human History Rhode, Olson& Chang, 2004 More realistic Model of Human History: Geography and Growth E(T) ~ 2300 years ago E(U) ~ 4500 years ago
 ~ 2300 years ago E(U) ~ 4500 years ago")
41
Probability of Data given a Pedigree. Elston-Stewart (1971) -Temporal Peeling Algorithm: Mother Father Condition on parental states Recombination and mutation are Markovian
 -Temporal Peeling Algorithm: Mother Father Condition on parental states Recombination and mutation are Markovian.")
42
Counting Pedigrees Tong Chen & Rune Lyngsø 0 1 2 1214 3 0 1 k k-1 ij i’j’ 24 3279 42.8*10 7 52.8*10 20 67.4*10 52 72.8*10 131 82.9*10 317 93.5*10 749 103.9*10 1737 A k (i,j) - the number of pedigrees k generations back with i females, k males.
 - the number of pedigrees k generations back with i females, k males.")
43
Pedigree Counting Counting gender un-labelled pedigrees Much harder. Counting gender labellings on un-labelled pedigree. gender un-labelable:

44
Inverting Random Functions & a bound on segregating sites needed to reconstruct a global pedigrees Steel & Szekely, 1998 + Steel and Hein, 2005 Number of segregating sites - s - needed to predict correct global pedigree with at least 0.5 probability of a population of size n for d generations Ex. 3*10 6, 300 generations (7000 years) this lower bound would give a minimum of 2000 sites. (probably a gross underestimate). The population can be partitioned into triples: a couple that gets a pair of children + an outsider that has a child with one of them. This creates a a mapping from a generation to the previous, fundamentally labeling all ancestors. The number of global pedigrees for k generations with 3n individuals:
 this lower bound would give a minimum of 2000 sites. (probably a gross underestimate). The population can be partitioned into triples: a couple that gets a pair of children + an outsider that has a child with one of them. This creates a a mapping from a generation to the previous, fundamentally labeling all ancestors. The number of global pedigrees for k generations with 3n individuals:.")
45
Reconstructing global pedigrees Steel and Hein, 2005 Knowing the gender-labeled pedigrees for all pairs, defines the global pedigree (last k generations) k gender labelling of ancestors are crucial Links and lassos determine the global pedigree (last k generations)
 k gender labelling of ancestors are crucial Links and lassos determine the global pedigree (last k generations)")
46
Genomes with and --> infinity recombination rate, mutation rate All embedded phylogenies are observable Do they determine the pedigree? Benevolent Mutation and Recombination Process Counter example:Embedded phylogenies:

47
Pedigree Reconstruction Principles Distance Based Reconstructions Subtree Transfer Identification of Ancestors Recursive Definition of Ancestral Genomes Gender specific rates Continuous Birth Time with Perfect Clock t2t2 t1t1 t3t3

48
The Coalescent with Recombination 1. Wiuf & Hein (1997): On the Number of Ancestors to a DNA Sequence 2. Wiuf & Hein (1999): The Ancestry of a Sample of Sequences Subject to Recombination 3. Wiuf & Hein (1999): The Coalescent with Recombination as a point process moving along sequences. 4. Wiuf & Hein (2000): The Coalescent with Gene Conversion Retrospective in stead of Prospective formulation of Genetical Processes (Ewens, 1979) 40s: retrospective arguments used by both Fisher and Wright. 75: Watterson full formulation of probability of genealogical relationship of a set of alleles. 82: Three Famous articles by Kingman. 83: Hudson Includes Recombination in Genealogical Process. Number of Ancestors to a DNA Sequence. Reformulation of Genealogical Process. Inclusion of Gene Conversion in Genealogical Process.
: On the Number of Ancestors to a DNA Sequence 2. Wiuf & Hein (1999): The Ancestry of a Sample of Sequences Subject to Recombination 3. Wiuf & Hein (1999): The Coalescent with Recombination as a point process moving along sequences. 4. Wiuf & Hein (2000): The Coalescent with Gene Conversion Retrospective in stead of Prospective formulation of Genetical Processes (Ewens, 1979) 40s: retrospective arguments used by both Fisher and Wright. 75: Watterson full formulation of probability of genealogical relationship of a set of alleles. 82: Three Famous articles by Kingman. 83: Hudson Includes Recombination in Genealogical Process. Number of Ancestors to a DNA Sequence. Reformulation of Genealogical Process. Inclusion of Gene Conversion in Genealogical Process..")
49
Finding Minimal Recombination Histories 1.J.J.Hein: Reconstructing the history of sequences subject to Gene Conversion and Recombination. Mathematical Biosciences. (1990) 98.185-200. 2.J.J.Hein: A Heuristic Method to Reconstruct the History of Sequences Subject to Recombination. J.Mol.Evol. 20.402-411. 1993 3.Hein,J.J., T.Jiang, L.Wang & K.Zhang (1996): "On the complexity of comparing evolutionary trees" Discrete Applied Mathematics 71.153-169 4.Song, Y.S. (2003) “On the combinatorics of rooted binary phylogenetic trees”. Annals of Combinatorics, 7:365–379 5.Song, Y.S. & Hein, J. (2005) Constructing Minimal Ancestral Recombination Graphs. J. Comp. Biol., 12:147–169Constructing Minimal Ancestral Recombination Graphs 6.Song, Y.S. & Hein, J. (2004) On the minimum number of recombination events in the evolutionary history of DNA sequences. J. Math. Biol., 48:160–186.On the minimum number of recombination events in the evolutionary history of DNA sequences. 7.Song, Y.S. & Hein, J. (2003) Parsimonious reconstruction of sequence evolution and haplotype blocks: finding the minimum number of recombination events, Lecture Notes in Bioinformatics, Proceedings of WABI'03, 2812:287–302. 8. Lyngsø, Song and Hein (2005) “Minimal Recombination Histories by Branch and Bound” WABI 64 Bodmer & Edwards: Parsimony defined as reconstruction principle 85 Hudson Kaplan uses minimal recombination histories as observed recombinations Attempts to find minimal histories of sequences Definition of recombination as Subtree Prune Regraft operations
 J.J.Hein: A Heuristic Method to Reconstruct the History of Sequences Subject to Recombination. J.Mol.Evol Hein,J.J., T.Jiang, L.Wang & K.Zhang (1996): On the complexity of comparing evolutionary trees Discrete Applied Mathematics Song, Y.S. (2003) On the combinatorics of rooted binary phylogenetic trees . Annals of Combinatorics, 7:365–379 5.Song, Y.S. & Hein, J. (2005) Constructing Minimal Ancestral Recombination Graphs. J. Comp. Biol., 12:147–169Constructing Minimal Ancestral Recombination Graphs 6.Song, Y.S. & Hein, J. (2004) On the minimum number of recombination events in the evolutionary history of DNA sequences. J. Math. Biol., 48:160–186.On the minimum number of recombination events in the evolutionary history of DNA sequences. 7.Song, Y.S. & Hein, J. (2003) Parsimonious reconstruction of sequence evolution and haplotype blocks: finding the minimum number of recombination events, Lecture Notes in Bioinformatics, Proceedings of WABI 03, 2812:287– Lyngsø, Song and Hein (2005) Minimal Recombination Histories by Branch and Bound WABI 64 Bodmer & Edwards: Parsimony defined as reconstruction principle 85 Hudson Kaplan uses minimal recombination histories as observed recombinations Attempts to find minimal histories of sequences Definition of recombination as Subtree Prune Regraft operations.")
50
Likelihood of Data Set 1.Song, Y.S., Lyngsø, R.B. & Hein, J. (2005) Counting Ancestral States in Population Genetics. In Press 72 Ewens likelihood of allele number observations 87 Griffiths recursions for infinite site data 90 Felsenstein uses Metropolis Hastings 94 Griffiths-Tavare uses MCMC on coalescent-mutation process 96 Griffiths-Marjoram uses MCMC on coalescent-mutation-recombination process 99+ Donnelly-Matthews-Fearnhead uses IS to accellerate earlier methods 00 Hudson introduces pseuodolikelihood method How hard is the coalescent-mutation-recombination process?
 Counting Ancestral States in Population Genetics. In Press 72 Ewens likelihood of allele number observations 87 Griffiths recursions for infinite site data 90 Felsenstein uses Metropolis Hastings 94 Griffiths-Tavare uses MCMC on coalescent-mutation process 96 Griffiths-Marjoram uses MCMC on coalescent-mutation-recombination process 99+ Donnelly-Matthews-Fearnhead uses IS to accellerate earlier methods 00 Hudson introduces pseuodolikelihood method How hard is the coalescent-mutation-recombination process .")
Similar presentations


>")


 A Fundamental Decomposition Theory for Phylogenetic Networks and Incompatible Characters.>")


 with a Single Homoplasy or Recombnation Event Yun S. Song, Yufeng Wu and Dan Gusfield University.>")