Download presentation
Presentation is loading. Please wait.

1
Medicaid Influence in the Drug Market Dana Costea PhD student, Department of Economics, Lehigh University Franklin Carter Assistant Professor, Marketing Department, Lehigh University Shin-Yi Chou Associate Professor, Department of Economics, Lehigh University Art King Professor, Department of Economics, Lehigh University 2007 APHA Annual Meeting Washington, DC, November 6, 2007

2
Why Medicaid and drugs? In 2005, Medicaid was responsible for providing health coverage and long-term care assistance to over 55 million people in low-income families or elderly and disabled; Total Medicaid spending increased between 2000 and 2005 from $205.7 billion to $304.4 billion, an average annual increase of 8.15%; In 2005, total Medicaid spending on prescription drugs was estimated to be $38.13 billion, representing approx. 19% of 2005 prescription drugs expenditures;

3
Medicaid regulations for prescription drugs Medicaid beneficiaries represent between 10 and 15 % of the total outpatient drug sales through pharmacies and other retail stores; Coverage of outpatient prescription drugs is an optional benefit to the beneficiaries, but all the states offer it; The plan assumes very low co-payments and no deductibles;

4
Medicaid regulations for prescription drugs (cont’d) Omnibus Budget Reconciliation Act of 1990 (OBRA ‘90) requires each pharmaceutical company to sign a drug rebate agreement in order to have its drugs covered by Medicaid; the states ensure that the manufacturers will receive federal funding for the outpatient drugs dispensed to Medicaid patients;
 Omnibus Budget Reconciliation Act of 1990 (OBRA ‘90) requires each pharmaceutical company to sign a drug rebate agreement in order to have its drugs covered by Medicaid; the states ensure that the manufacturers will receive federal funding for the outpatient drugs dispensed to Medicaid patients;")
5
Medicaid rebate There are two ways to calculate the rebate for brand- name drugs: - 15.1% of Average manufacturer price (AMP) - the difference between AMP and the best price Depending which one is greater, that one is the rebate that the manufacturers have to pay.
 - the difference between AMP and the best price Depending which one is greater, that one is the rebate that the manufacturers have to pay.")
6
Definitions AMP = average unit price paid to the drug company by wholesalers for drugs distributed to the retail pharmacies (excluding direct sales to hospitals, HMOs); Best price = lowest price at which the manufacturer sells the drug to any purchaser in the US in the quarter when AMP is calculated. It includes prices to wholesalers, retailers, nonprofit entities or governmental entities within the States;

7
Example AMP=$20 Best price=$10 The flat rebate: 15.1%*$20=$3.02 The best price discount: $20 - $10=$10 (50% AMP) The final rebate will be 50%AMP
 The final rebate will be 50%AMP")
8
Medicaid reimbursement process 1. The states reimburse the pharmacies for the drugs dispensed based either on the average wholesale price (AWP) or on the wholesale acquisition cost (WAC); the reimbursement vary between 84% and 95% of AWP or between 105% and 109.2% of WAC; the pharmacies also receive a dispensing fee that varies between $1.75 (New Hampshire) and $11.46 in Alaska; 2. The federal government reimburses the states for a part of these costs; 3. The pharmaceutical companies pay the Medicaid rebate directly to the states based on the quantity of drugs purchased by the Medicaid beneficiaries.
 or on the wholesale acquisition cost (WAC); the reimbursement vary between 84% and 95% of AWP or between 105% and 109.2% of WAC; the pharmacies also receive a dispensing fee that varies between $1.75 (New Hampshire) and $11.46 in Alaska; 2. The federal government reimburses the states for a part of these costs; 3. The pharmaceutical companies pay the Medicaid rebate directly to the states based on the quantity of drugs purchased by the Medicaid beneficiaries..")
9
Theoretical considerations Theory of discrimination : different consumers are charged different prices depending on their elasticity of demand; the consumers with the lowest elasticity pay the most; Medicaid has access to the lowest price charged in the industry through ORBA’90 so manufacturers cannot give high discounts to any other buyer - that would lower the price they can get from the Medicaid beneficiaries; The size of the Medicaid market share compared to the rest of the buyers and their elasticity of demand can influence the price and lead to either an increase or a decrease in the optimal price that the pharmaceutical companies charge.

10
Research questions and ways to answer them Does Medicaid influence the activity in the drug market? If so, how? And how much? Methods: study the effect Medicaid market share for a specific drug has on the average price per prescription.

11
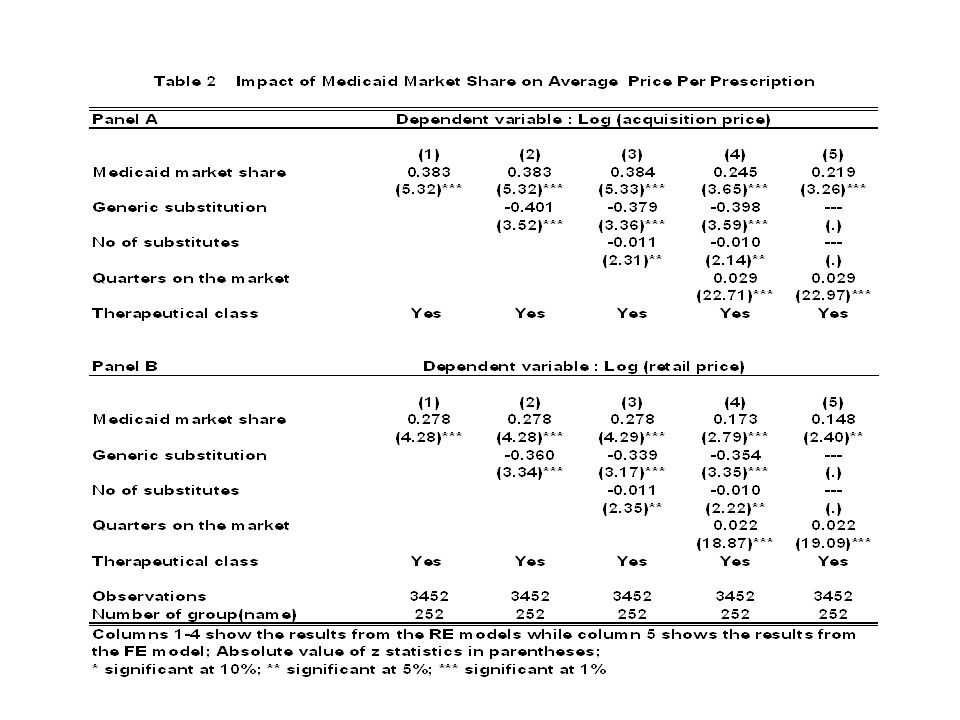
Results The results show that 10-percentage point increase in the Medicaid Market Share will lead to a 2.4% increase in the average acquisition price per prescription- the effect is higher than on the average retail price where 10- percentage point increase in MMS will lead to 1.7% increase in price OBRA ’90 and the Medicaid drug rebate give the pharmaceutical companies incentives to raise the price of pharmaceuticals some consumers may be worse off

12
Related literature Scott Morton (1997) – analyses the effect of best price provision on pharmaceutical prices; – Findings: some pharmaceutical consumers face higher prices due to this provision Duggan and Scott Morton (2006)- study the relationship between Medicaid market share (MMS) and average price per prescriptions – Findings: a 10 percentage-point increase in the MMS is associated with a 7 to 10 percent increase in the average price per prescription
 – analyses the effect of best price provision on pharmaceutical prices; – Findings: some pharmaceutical consumers face higher prices due to this provision Duggan and Scott Morton (2006)- study the relationship between Medicaid market share (MMS) and average price per prescriptions – Findings: a 10 percentage-point increase in the MMS is associated with a 7 to 10 percent increase in the average price per prescription")
13
Our contribution Use of panel data and thus the possibility of studying the effect of the change in one drug’s MMS on price and not only the change in MMS across multiple drugs; Use of private sector prices- average acquisition price for the pharmacies and the average retail price paid by the consumers; Use of quarterly prices, as each company has to report their price structure to CMS within 30 days from the end of each quarter.

14
Data IMS New Product Spectra-new drugs launched in the US from December 1984 to October 2003; each drug is tracked for a maximum of 60 month after the launch date (each drug has a max of 22 observations); We aggregated the data by quarter; We dropped the observations that had missing information about price or Medicaid market share; we also dropped the drugs launched before 1990 and the drugs that were for sure/possible not to be covered by Medicaid- injectables and other certain categories of drugs; Final sample= 252 drugs (3452 observations).
; We aggregated the data by quarter; We dropped the observations that had missing information about price or Medicaid market share; we also dropped the drugs launched before 1990 and the drugs that were for sure/possible not to be covered by Medicaid- injectables and other certain categories of drugs; Final sample= 252 drugs (3452 observations).")
15
Model and variables Log (av_price) = f (Medicaid market share, generic competition, number of substitutes, quarters on the market, therapeutical class) Average acquisition price= The pharmacy acquisition cost, calculated as the average cost to all reported pharmacies during a specific period of time for each new prescription Average retail price = The average cost to the consumer for each new prescription during a specific time period Medicaid market share (MMS)= Medicaid prescriptions/total prescriptions Generic competition = 0 if the drug doesn’t face generic competition, 1 if it does Number of substitutes= the number of drugs already existing in the market in the same therapeutic category at the moment that our drug entered the market Quarters on the market= number of quarters the drug has been on the market since launching Therapeutic class = dummy variable for each 34 therapeutic classes
 = f (Medicaid market share, generic competition, number of substitutes, quarters on the market, therapeutical class) Average acquisition price= The pharmacy acquisition cost, calculated as the average cost to all reported pharmacies during a specific period of time for each new prescription Average retail price = The average cost to the consumer for each new prescription during a specific time period Medicaid market share (MMS)= Medicaid prescriptions/total prescriptions Generic competition = 0 if the drug doesn’t face generic competition, 1 if it does Number of substitutes= the number of drugs already existing in the market in the same therapeutic category at the moment that our drug entered the market Quarters on the market= number of quarters the drug has been on the market since launching Therapeutic class = dummy variable for each 34 therapeutic classes")
17
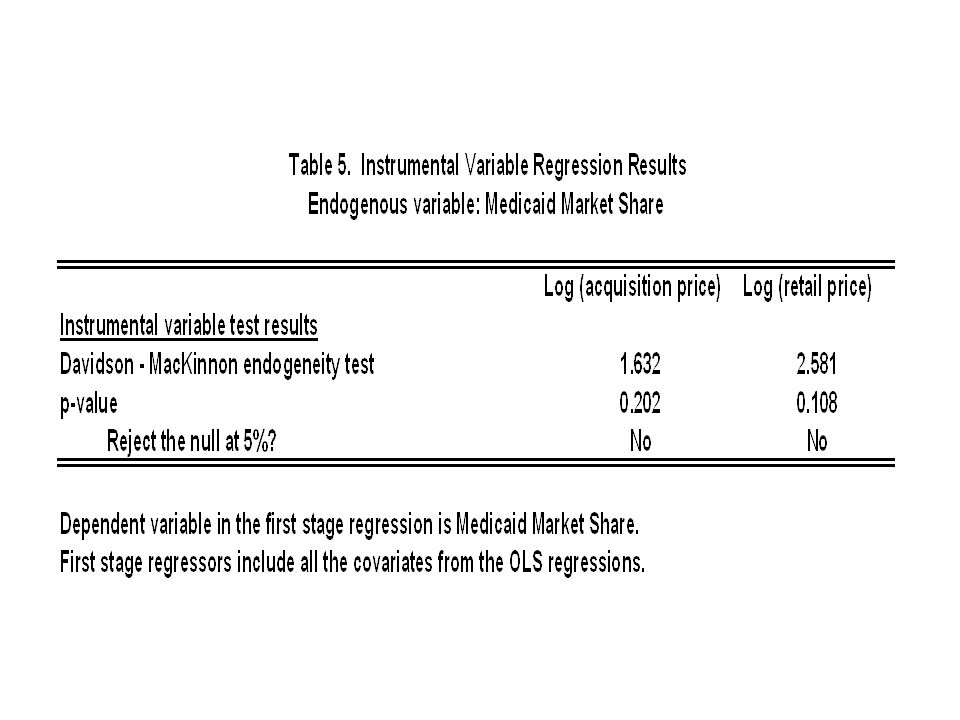
Instrumental variable strategy Instrument: potential Medicaid market share Construction: - we found out for which indications each drug in the sample is prescribed; - we matched each indication with the ICD9 codes using the Centers for Disease Control list; - using data from 1991 to 2003 of the National Ambulatory Medical Care Survey we determined what fraction of patients are on Medicaid for each ICD9 code, in each year and quarter.

19
Conclusion The results show that 10-percentage point increase in the Medicaid Market Share will lead to a 2.4% increase in the average acquisition price per prescription - the effect is higher than on the average retail price where 10-percentage point increase in MMS will lead to 1.7% increase in price; OBRA ’90 and the Medicaid drug rebate could give the pharmaceutical companies incentives to raise the price of pharmaceuticals some consumers may be worse off.

Similar presentations


 Javier Menendez, RPh Pharmacy Manager Department of Medical Assistance.>")


 Presented By: Zhou Ge & Stephen Stults.>")


Slide 1.>")