Download presentation
Presentation is loading. Please wait.

1
Analytical Chemistry Lab, Department of Chemistry, Yonsei University
Raman Spectroscopy Analytical Chemistry Lab, Department of Chemistry, Yonsei University

2
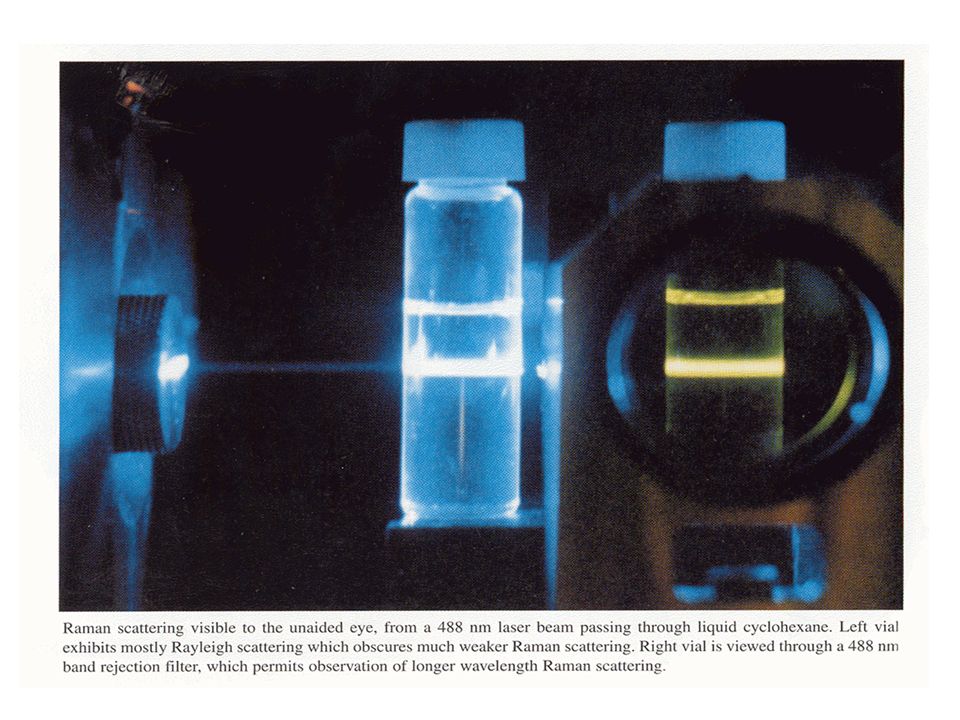
Raman scattering or the Raman effect is the inelastic scattering of a photon. Discovered by Sir Chandrasekhara Venkata Raman and Kariamanickam Srinivasa Krishnan in liquids Raman received the Nobel Prize in 1930

3
라만 산란이란? 정의 : 단색광을 기체 또는 투명한 액체·고체에 쬐면 산란광 속에 파장이 약간 다른 빛이 생기는 현상
산란 :빛이 어떤 매질을 통과할 때 빛의 일부는 진행 방향에서 이탈해 다른 방향으로 진행하는 현상.

4
Raman Spectroscopy 1923 – Inelastic light scattering is predicted by A. Smekel 1928 – Landsberg and Mandelstam see unexpected frequency shifts in scattering from quartz 1928 – C.V. Raman and K.S. Krishnan see “feeble fluorescence” from neat solvents First Raman Spectra: Filtered Hg arc lamp spectrum: C6H6 Scattering

5
Raman Spectroscopy 1923 – Inelastic light scattering is predicted by A. Smekel 1928 – Landsberg and Mandelstam see unexpected frequency shifts in scattering from quartz 1928 – C.V. Raman and K.S. Krishnan see “feeble fluorescence” from neat solvents 1930 – C.V. Raman wins Nobel Prize in Physics 1961 – Invention of laser makes Raman experiments reasonable 1977 – Surface-enhanced Raman scattering (SERS) is discovered 1997 – Single molecule SERS is possible
 is discovered – Single molecule SERS is possible.")
6
광원의 에너지는 증가하고 분자의 에너지는 감소한다. 진동여기 상태에 있던 분자는 바닥상태로 떨어진다.
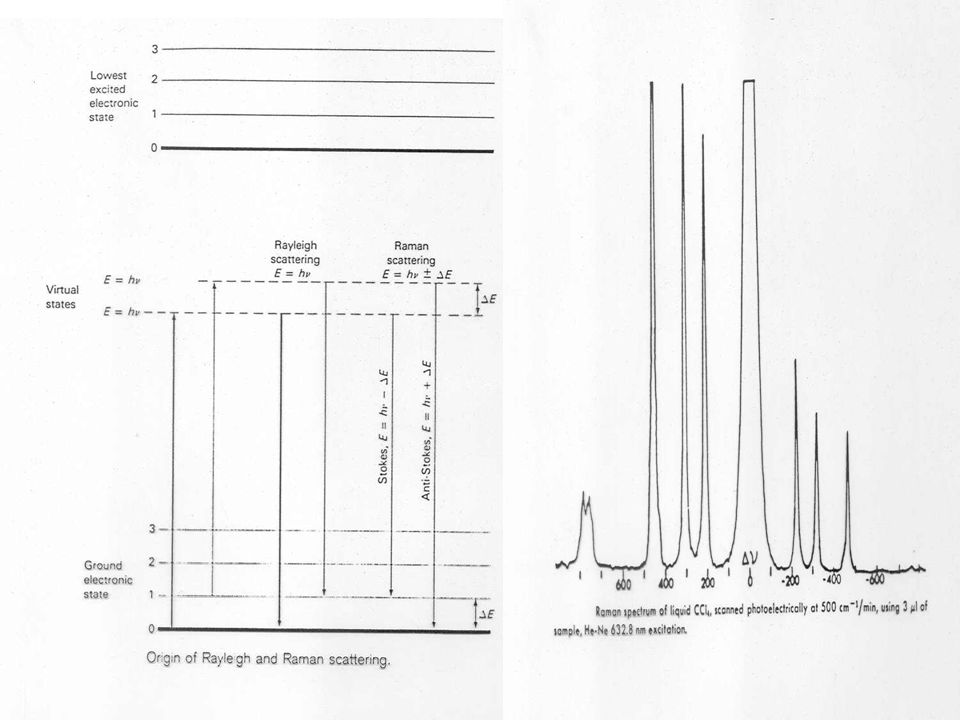
라만 산란과정의 양자 역학적 이해 광원의 에너지는 증가하고 분자의 에너지는 감소한다. 진동여기 상태에 있던 분자는 바닥상태로 떨어진다. 광원의 에너지는 감소하고 분자의 에너지는 증가한다. 분자의 진동전이가 일어남 광원과 분자의 에너지 상태는 변하지 않음 광원 광원v0-v1 광원v0+v1 v1 v1 Rayleigh scattering Stokes 효과 Anti-Stokes 효과 Raman scattering

7
Raman Spectroscopy The Raman spectroscopy effect arises when a beam of intense monochromatic light passes through a sample that contains molecules that can undergo a change on molecular polarization as they vibrate.

8
라만 산란과정은 분자의 진동 전위 변화를 시킨다.
하지만 직접적으로 v1을 측정할 수는 없고 산란되는 빛이 rayleigh 산란과 비교해 얼마만큼 에너지를 잃었는가 혹은 얻었는가를 관찰함으로써 v1을 측정한다. 스펙트럼은 산란된 빛이 Rayleigh scattering 에 대해 얼마만큼 shift되었는가를 Raman shift 로 표시하며 이 Raman shift는 분자의 진동 주파수에 해당한다. 따라서 라만 분광법은 IR분광법과 같이 분자의 진동 형태, 회전상태에 대한 정보를 얻기 위해 사용되지만 IR분광법에서와는 다른 메카니즘과 선택 규칙에 근거하며 측정방법도 다름을 알 수있다.

9
Rayleigh Scattering Elastic ( does not change)
Random direction of emission Little energy loss Eugene Hecht, Optics, Addison-Wesley, Reading, MA, 1998.

10
1 in 107 photons is scattered inelastically
Raman Spectroscopy 1 in 107 photons is scattered inelastically Infrared (absorption) Raman (scattering) v” = 0 v” = 1 virtual state Excitation Scattered Rotational Raman Vibrational Raman Electronic Raman
 Raman. (scattering) v = 0. v = 1. virtual. state. Excitation. Scattered. Rotational Raman. Vibrational Raman. Electronic Raman.")
13
Presentation of Raman Spectra
lex = 1064 nm = 9399 cm-1 Breathing mode: 9399 – 992 = 8407 cm-1 Stretching mode: 9399 – 3063 = 6336 cm-1

14
Spectral peaks in normal Raman spectrometry are commonly 10-5 to 10-7 times weaker than the incident radiation Some Raman lines are closely adjacent to the exciting wavelength Raman peaks must be observed against a background of stray light originated from Rayleigh scattering. Often Raman peaks must be separated from the fluorescence of analytes or sample impurities

15
Raman Vs IR 분광학 진동 준위 에너지 차 v에 해당하는 에너지를 가진 빛이 입사한 후 그 파장의 빛의 세기가
얼마나 약해졌는지 측정한다. 큰 에너지를 주고 빛의 파장이 얼마나 길어졌는지 혹은 짧아 졌는지 측정한다. v。 v。-v v v Raman scattering(stokes) IR spectrum
 IR spectrum.")
16
Raman Vs IR 분광학 예) 이산화탄소(CO2) 선택률의 차이
Symmetric Vibration Anti-symmetric Vibration Bending Raman ; active IR : inactive Raman ; inactive IR : active Raman ; inactive IR : active 선택률의 차이 적외선 분광학 : 분자의 진동 모드중 이중 극자 모멘트의 변화가 있는 모드만 IR 흡수를 한다. 라만 분광학 : 분자의 진동 모드중 편극도의 변화가 있는 모드만 라만 산란이 일어난다. Symmetric Vibration : 라만 스펙트럼에서 강하게 일어남 C=C S-S N2 O2… Anti-symmetric Vibration :IR스펙트럼에서 강하게 일어남 C=O O-H C=N C-H

17
Raman active Raman inactive Raman inactive

18
Ingle and Crouch, Spectrochemical Analysis
Raman vs IR Spectra Ingle and Crouch, Spectrochemical Analysis

19
Raman vs Infrared Spectra
McCreery, R. L., Raman Spectroscopy for Chemical Analysis, 3rd ed., Wiley, New York: 2000

20
Raman vs Infrared Spectra
McCreery, R. L., Raman Spectroscopy for Chemical Analysis, 3rd ed., Wiley, New York: 2000

21
Raman Intensities Radiant power of Raman scattering:
s(nex) – Raman scattering cross-section (cm2) nex – excitation frequency E0 – incident beam irradiance ni – number density in state i exponential – Boltzmann factor for state i s(nex) - target area presented by a molecule for scattering
 – Raman scattering cross-section (cm2) nex – excitation frequency. E0 – incident beam irradiance. ni – number density in state i. exponential – Boltzmann factor for state i. s(nex) - target area presented by a molecule for scattering.")
22
Comparison of Raman with Infrared Spectroscopy
Raman spectroscopy can be used to detect and analyze molecules with inactive spectra Raman can be use to study materials in aqueous solution Ability to examine the entire vibrational spectrum with one instrument Spectrum is relatively simple and possible to assign all of Raman bands Sample preparation for Raman is generally simpler Intensity of spontaneous Raman lines increase linearly with concentration

23
Advantages of IR over Raman
Simpler and cheaper instrumentation. Less instrument dependent than Raman spectra because IR spectra are based on measurement of intensity ratio. Lower detection limit than (normal) Raman. Background fluorescence can overwhelm Raman. More suitable for vibrations of bonds with very low polarizability (e.g. C–F).
 Raman. Background fluorescence can overwhelm Raman. More suitable for vibrations of bonds with very low polarizability (e.g. C–F).")
24
Shortcomings of Raman Sample must be free from dust particle
Fluorescence background Photo and heat make sample degradation and/or unwanted side reaction Relatively high cost and experts needed

25
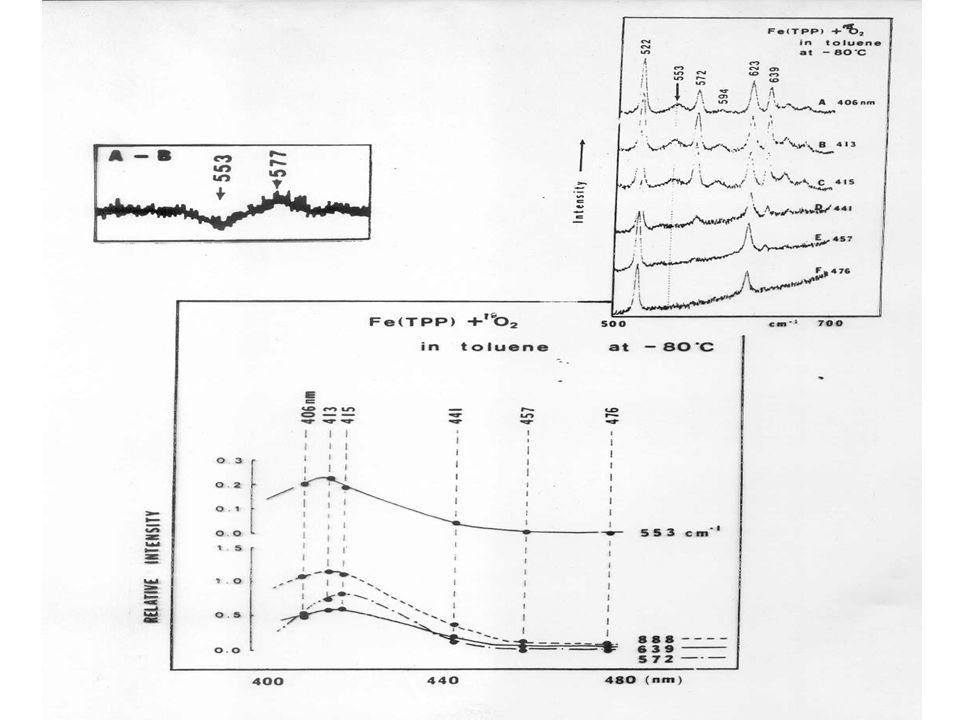
Resonance Raman It is important to appreciate that the magnitude of Raman shift are independent of the wavelength of excitation The resonance Raman results from the promotion of an electron into an excited vibrational state, accompanied by immediate relaxation into a vibrational level of the ground state 3) Raman line intensities are greatly enhanced (10 2 ~10 6 times) by excitation w/ l that is close to labs of a molecule
 Raman line intensities are greatly enhanced (10 2 ~10 6 times) by excitation w/ l that is close to labs of a molecule.")
26
Resonance Raman Spectra
lex = nm lex = nm

27
Spectra from Background Subtraction
McCreery, R. L., Raman Spectroscopy for Chemical Analysis, 3rd ed., Wiley, New York: 2000

28
Fluorescence Background in Raman Scattering
McCreery, R. L., Raman Spectroscopy for Chemical Analysis, 3rd ed., Wiley, New York: 2000

31
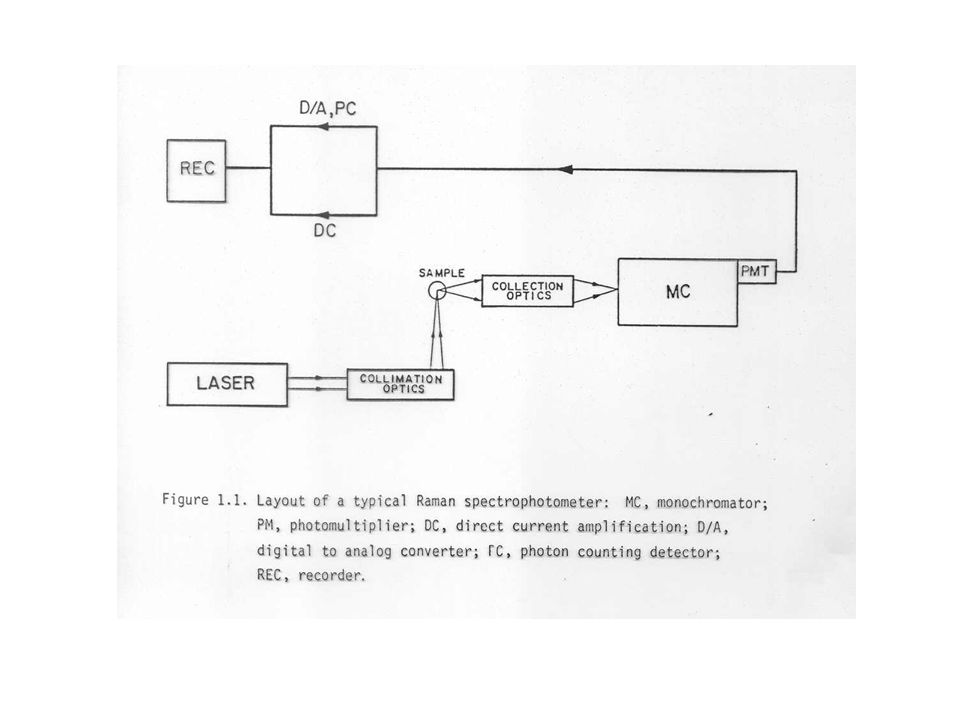
Basic components of the Raman
A source, usually a CW gas laser A sample illuminating system A sample holder A double or triple monochromator A signal processing system-including a PMT and amplification system, an output device

33
Advantages of laser High intensity Highly monochromatic
Small beam diameter * no dispersion * can apply to microsample Polarization: 100 % linearity Excitation frequency can be varied

35
* Liquid sample

36
Rotating Raman Cells Rubinson, K. A., Rubinson, J. F., Contemporary Instrumental Analysis, Prentice Hall, New Jersey: 2000

37
Solid Sample

38
Raman Spectroscopy: PMT vs CCD
McCreery, R. L., Raman Spectroscopy for Chemical Analysis, 3rd ed., Wiley, New York: 2000

39
Dispersive and FT-Raman Spectrometry
McCreery, R. L., Raman Spectroscopy for Chemical Analysis, 3rd ed., Wiley, New York: 2000

41
Overall review Raman spectra give information on molecular vibrations and are obtained from changes in the frequency of light observed in a scattering experiment ( inelastic scattering) The gross selection rule: The physical picture arises from considering changes in polarization (induced dipole moment) that arise if a vibration occurs during the time the electrons are oscillating in response to the applied radiation Camparision of the spectra polarized perpendicular and pararell to the incident light gives information on the symmetry of the vibrational motions
 The gross selection rule: The physical picture arises from considering changes in polarization (induced dipole moment) that arise if a vibration occurs during the time the electrons are oscillating in response to the applied radiation. Camparision of the spectra polarized perpendicular and pararell to the incident light gives information on the symmetry of the vibrational motions.")
42
4. Raman spectra can be obtained in water
4. Raman spectra can be obtained in water. This is a major advantage over IR 5. Resonance Raman spectra result when the wavelength of the exciting light falls within an electronic absorption band of a chromophore in the molecule. Some vibrations associated with such a chromophore may be enhanced by factors of 1000 or more 6. The experimental parameters of a band in a spectrum are its position (Dn) (which is independent of the frequency of the exciting light), its intensity (which is directly propotional to concentration), and its polarization
 (which is independent of the frequency of the exciting light), its intensity (which is directly propotional to concentration), and its polarization.")
Similar presentations
 Introduction IR Raman>")


