Download presentation
Presentation is loading. Please wait.

1
The ‘Centre Effect’ and Statistical Process Control Alex Hodsman

2
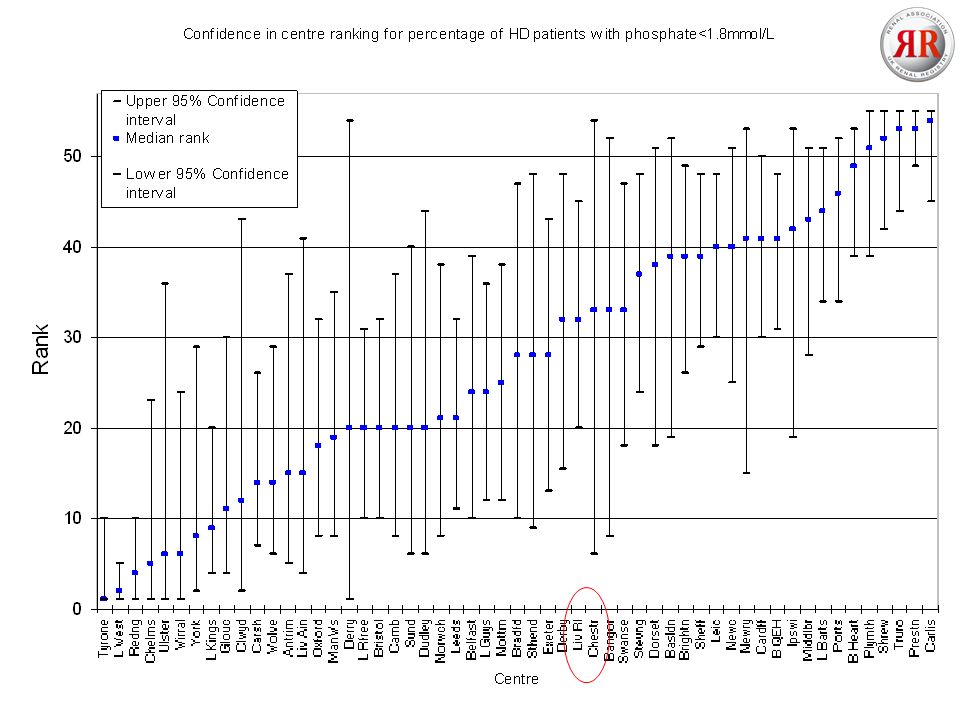
Liv RI – Rank 31 Chester – Rank 35

4
CentreN% < 1.8mmol/L 95% CI for %<1.8mmol/LMedian rank 95% CI for rank Probability of being in ‘top 10 centres’ (%) Probability of being in ‘last 10 centres’ (%) Tyrone8083.874.0 - 90.311 - 10980 London West 102682.179.6 - 84.321 - 51000 Reading20979.973.9 - 84.841 - 1097.90 Chelmsford8378.368.2 - 85.951 - 2384.20 Derby18964.657.5 - 71.03216 - 480.35.9 Bangor6264.551.9 - 75.4338 - 525.318.2 Swansea24764.458.2 - 70.13318 - 470.14.1 Chester4264.348.9 - 77.2336 - 548.523.7 Stevenage30662.857.2 - 68.03724 - 4808.9 Dorset13262.153.6 - 70.03818 - 510.222.2 Shrewsbury12352.043.2 - 60.75242 - 55094.3 Truro14251.443.2 - 59.55344 - 55096.4 Preston32550.845.4 - 56.25349 - 55099.8 Carlisle7748.137.2 - 59.15445 - 55097.5
 Probability of being in ‘last 10 centres’ (%) Tyrone London West Reading Chelmsford Derby Bangor Swansea Chester Stevenage Dorset Shrewsbury Truro Preston Carlisle")
5
What are the aims for comparing centre outcomes? 1.Identify ‘meaningful’ differences between centres 2.Identify improvement/deterioration 3.Multiple simultaneous comparisons 4.Make fair comparisons 5.(Identify modifiable clinical processes)
.")
6
Why use SPC? Inter centre variability in outcome measures –Chance –Data quality –Definitions –Case mix –Quality of care Organisational structure Processes of care Intra centre variability in outcome measures

7
SPC Method of monitoring, controlling improving a process through statistical analysis Key principles –Variability in all systems –Differentiate ‘special cause’ from ‘normal random’ variation –Identify and improve processes to reduce special cause variation

9
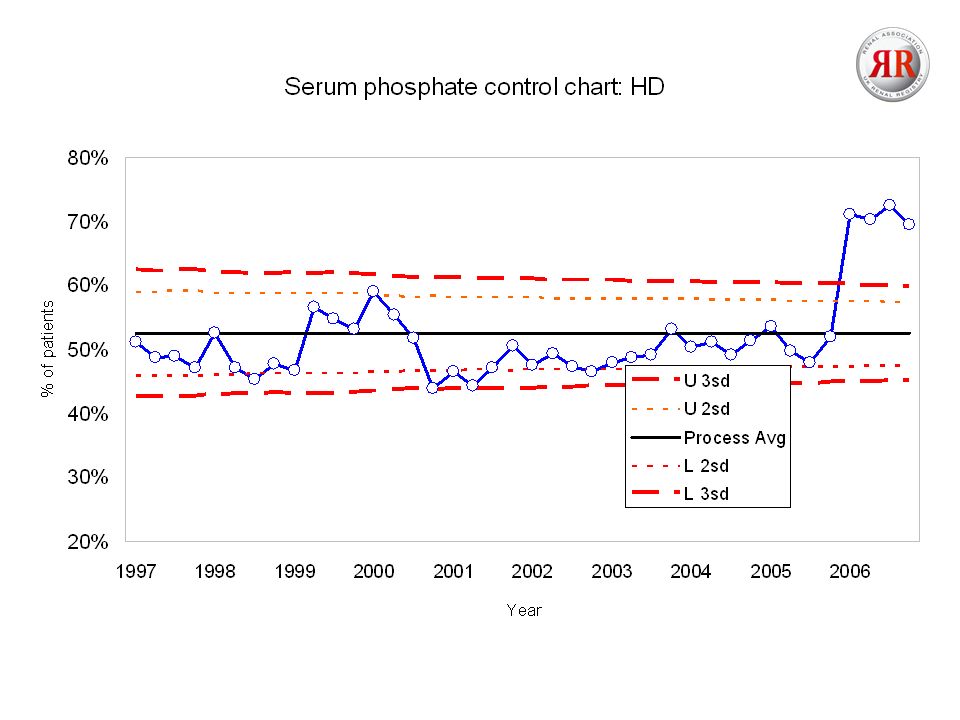
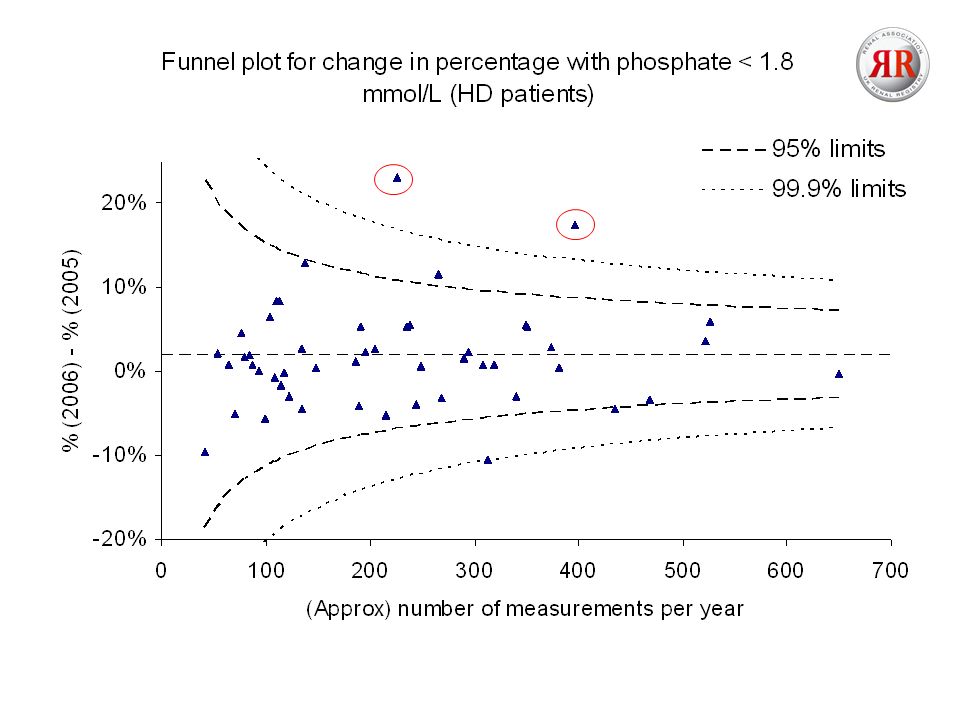
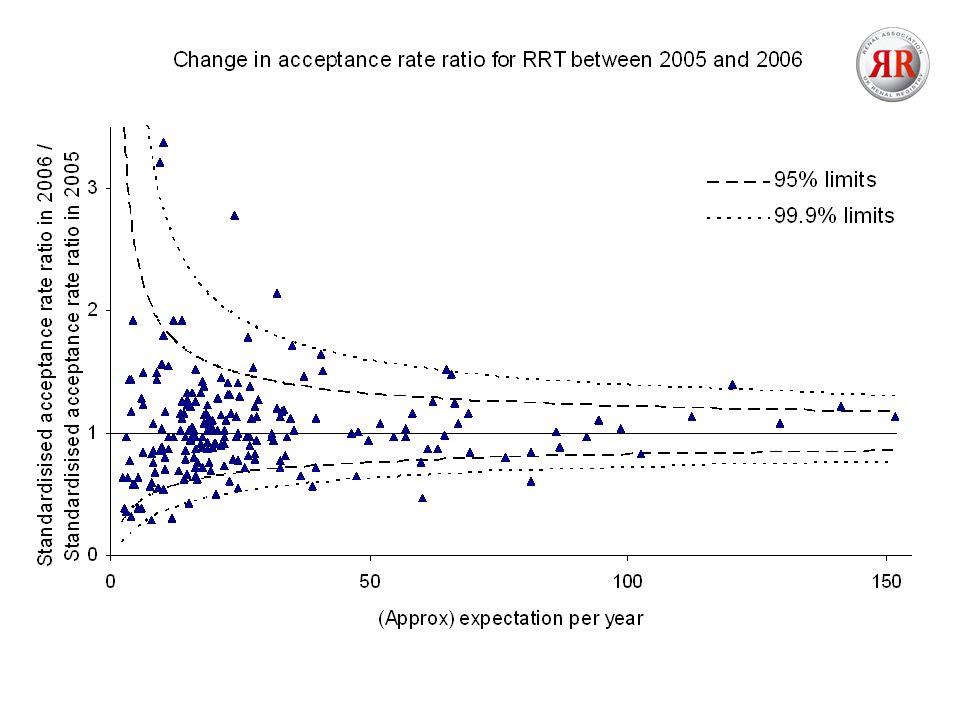
Examples of SPC Cross sectional –Funnel plots Longitudinal –Control charts –CUSUM, EWMA, SPRT etc.. Hybrid –Funnel plots

10
Principles of SPC

11
Cross sectional plots Specificity False positive rate/Type 1 error 3SD = 0.27% 2SD = 5%

12
Longitudinal plots Type 1 error 25 data points 3SD = 6.5% 2SD = 27.7%

13
Longitudinal plots - Interpretation Shewhart’s original rule –> 3SDs from the process average Numerous additional rules –Patterns/Trends in the data –E.g. 7 points in the same direction –Enhance sensitivity –Probability calculations

14
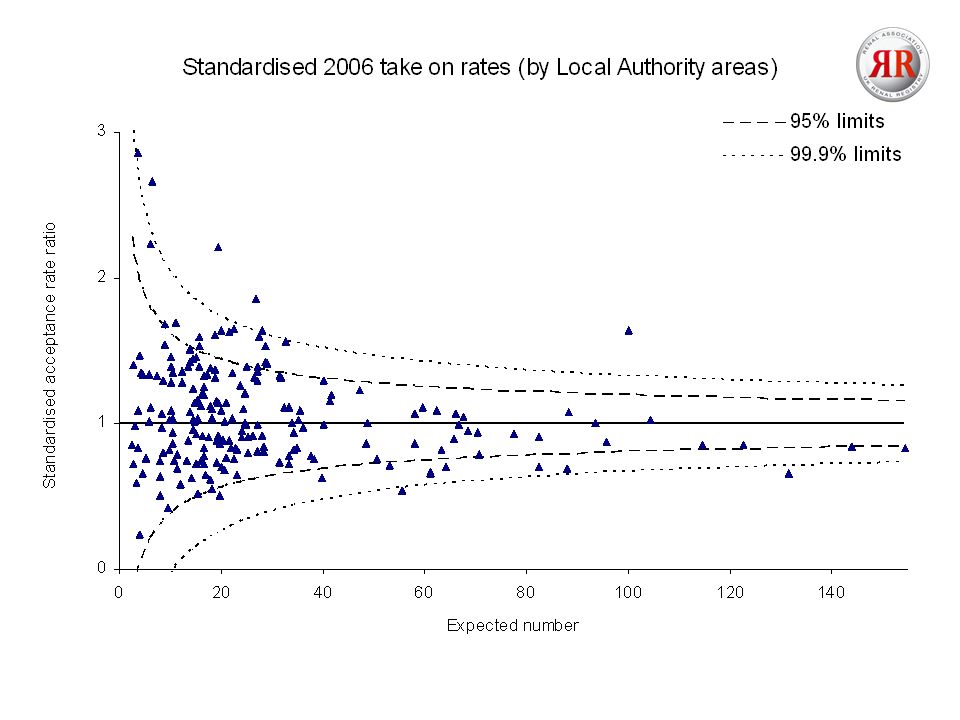
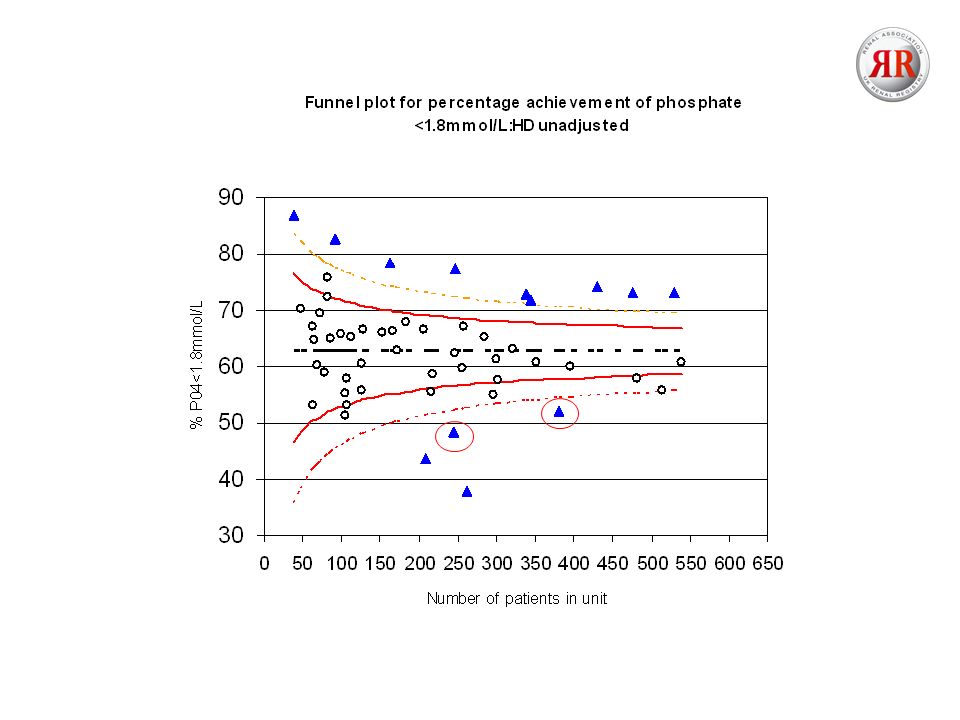
2004 Report Funnel plot of age adjusted 1 year after 90 days survival, 2002-2005 cohort 2006 Report Funnel plot of % with serum phosphate<1.8mmol/L:HD SPC and the UKRR

22
Phosphate distributions

27
Cross sectional vs. Longitudinal Cross sectional Inter centre variability Good for looking at stable unit characteristics –Data, Case mix, Organisational structure Longitudinal Intra centre variability Good for looking at less stable unit characteristics –Data, Processes of care

28
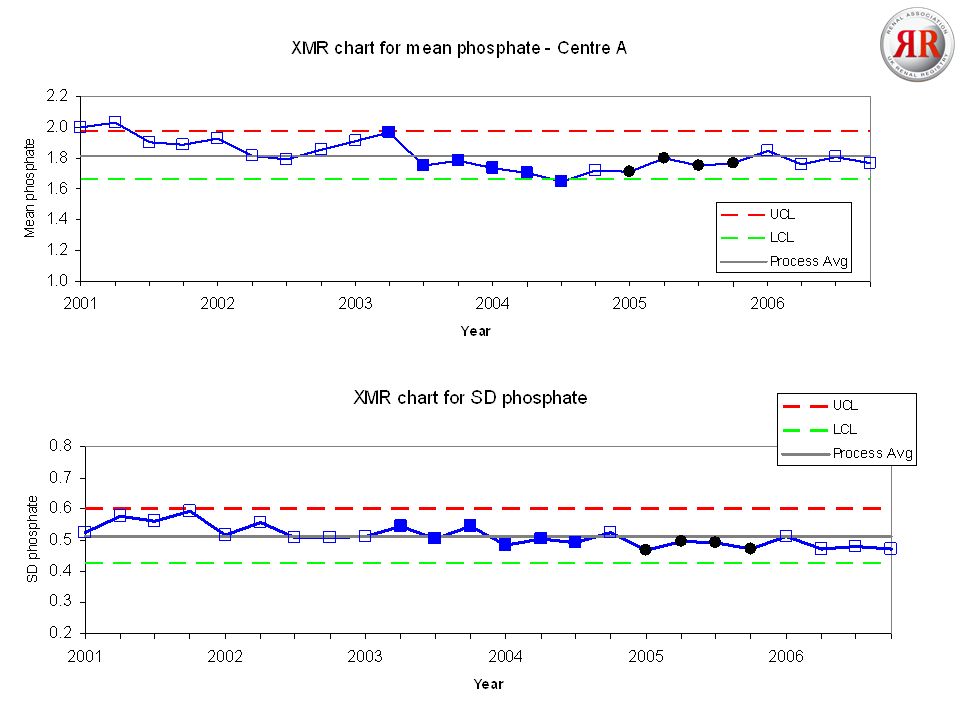
Data collection Define specification of audit measure Funnel plot to compare all centres Identify and analyse outliers Check data against local audit data Data correctData incorrect Refer to control chart to identify time of UKRR fault Individual control chart for each centre Updated quarterly P chart - % achieving audit measure XMR chart for mean XMR chart for SD ? Also include a measure of process capability Investigate causes Case mix Quality (organisational structure) Investigate causes Quality (processes of care)
 Investigate causes Quality (processes of care).")
29
Conclusions Methodical diagnostic approach to performance Takes chance out of the equation Focus resources Statistics are complex but the output is user friendly Limited ability to compare centres longitudinally i.e. rate of change

Similar presentations


. Quality of Manufacturing Process depends on Entry Criteria.>")


 2009 John Wiley & Sons, Inc.>")


: X-bar, R, p, c, process capability.>")

. When we have two sets of data and we want to know whether there is any statistically significant difference.>")


