Download presentation
Presentation is loading. Please wait.

1
How do we know? Spectroscopy: Experimental Evidence

3
Notebooking This unit is NOT in your textbook. I will provide you with the information you need and resources for the AP test. You will be required to take notes, and participate in notebooking activities that I will collect at the end of the unit.

4
Pre- and Post- Test You will complete a pre-test today, and will be asked to complete a post-test at the end of the mini-unit. You will receive points based on effort, not accuracy for these 2 tests. As a follow-up, you will get into small groups to answer AP-style questions relating to the unit.

5
Our current models and understandings of atoms and molecules are supported by experimental evidence from modern technologies. If new experimental evidence becomes available, our models and understandings are subject to change.

6
How can we explain the colored appearance of some analytes in solution and how do we know the concentration of these analytes?

7
Ultraviolet/Visible (UV/Vis) Spectroscopy
 Spectroscopy")
8
Ultraviolet/Visible Spectroscopy Ultraviolet/visible spectroscopy measures a molecule's absorption (or reflectance) of light in the ultraviolet-visible spectral region. The absorption or reflectance in the visible region directly affects the perceived color of the chemicals involved. This spectroscopy can be used to quantify the concentration of analytes in solution.

9
Demonstration Instructions: 1.Two cups will be placed on top of a light, each containing the same amount of water. 2 drops of food coloring will be added to one (cup A) and 4 drops of food coloring will be added to the other (cup B). Predict what you will observe and then record your observations in your notebook. 1.Two cups will be placed on top of a light. ⅓ of cup A will be placed in one (cup C) and ⅔ of cup A will be placed in the other (cup D). Predict what you will observe and then record your observations on your worksheet.
 and 4 drops of food coloring will be added to the other (cup B). Predict what you will observe and then record your observations in your notebook. 1.Two cups will be placed on top of a light. ⅓ of cup A will be placed in one (cup C) and ⅔ of cup A will be placed in the other (cup D). Predict what you will observe and then record your observations on your worksheet..")
10
Beer’s Law a = εbc where a is the absorbance, ε is the molar absorptivity coefficient, b is the path length of light, and c is the concentration of the analyte.

11
How do we know that atoms are relatively spherical and are closely packed in geometric arrangements in solids?

12
Scanning Probe Microscopy

13
Demonstration Instructions: 1.Cut a strip off the side of a magnet. 1.Rotate the magnet 90 degrees and cut another strip off the side. 1.Predict on your worksheet how the strips will interact with the remainder of the magnet. 1.Test your prediction and record your observations on your worksheet.

14
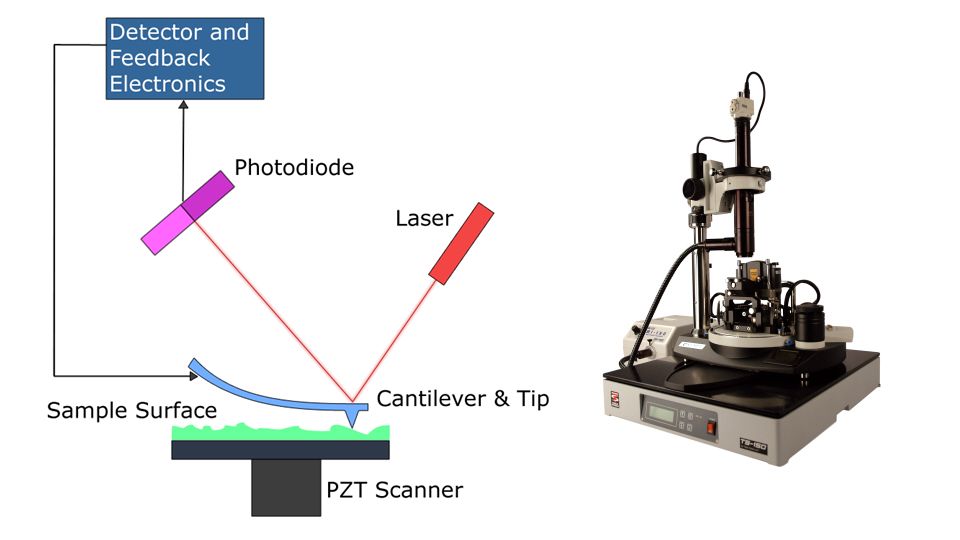
Scanning Probe Microscopy (SPM) Scanning probe microscopy (SPM) is a branch of microscopy that forms images of surfaces using a physical probe that scans the specimen. The resolution varies somewhat from technique to technique, but some probe techniques reach a rather impressive atomic resolution. Scanning probe microscopy image of gold atoms

16
How do we know that isotopes exist?

17
Mass Spectrometry

18
Demonstration Instructions: A neodymium magnet has been attached to the back side of a whiteboard. A ramp has been positioned to roll the balls down. A glass ball and several different sized steel balls will be rolled down the ramp and across the whiteboard. 1.Before each ball is rolled, predict what will happen. 1.After each ball is rolled record your observations. Include a sketch. magnet (on underside of whiteboard) ramp whiteboard glass ball steel balls
 ramp whiteboard glass ball steel balls.")
20
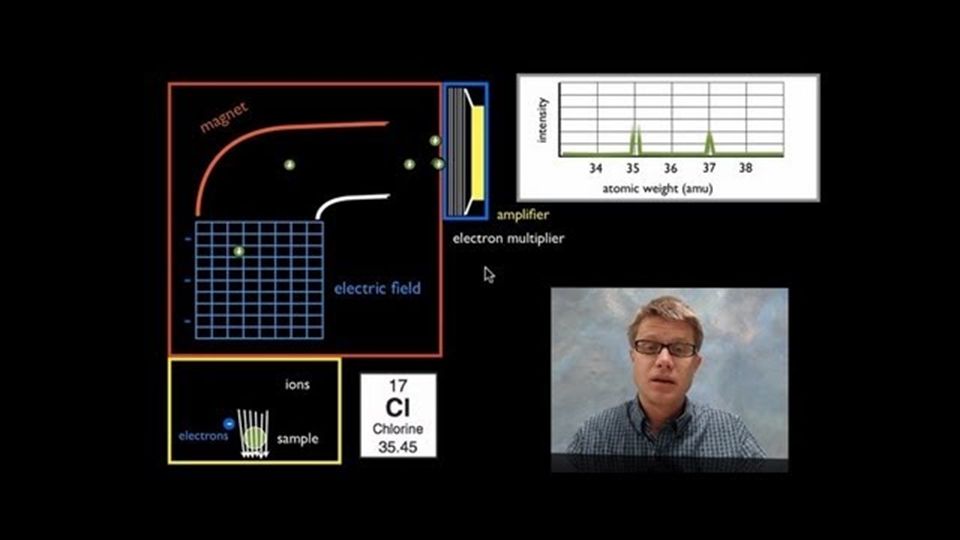
Mass Spectrometry Atoms (or molecules) are ionized as they enter the mass spectrometer. An applied electric field then accelerates these positive ions into a magnetic field. The most massive ions are deflected the smallest, the least massive ions are deflected the most. A comparison of positions where the ions hit the detector plate gives very accurate values of their relative masses. The most accurate way we currently have for determining the mass of atoms involves using a mass spectrometer.

21
Simplified Mass Spectrum of Silicon Silicon has 3 naturally occurring isotopes: ●silicon-28 (92.2297%) ●silicon-29 (4.6832%) ●silicon-30 (3.0872%) The average atomic mass of silicon is 28.086.
 ●silicon-29 (4.6832%) ●silicon-30 (3.0872%) The average atomic mass of silicon is")
22
How have we verified the shell aspect of the Quantum Mechanical Model?

23
Photoelectron Spectroscopy (PES or XPS)
")
24
Photoelectric Effect When metals are struck with high frequency radiation, electrons are ejected from the surface of the metal.

25
Photoelectron Spectroscopy A sample is exposed to a beam of light (generally x-ray or UV light) This causes photoelectric emission. The electrons that are emitted are collected at a detector. The energies of the emitted electrons are characteristic of their original electronic states.

26
Simplified PES Spectrum of Aluminum The electron configuration of aluminum is 1s 2 2s 2 2p 6 3s 2 3p 1 Keep in mind “binding energy” is similar in concept to ionization energy.

27
How do we know there are different types of covalent bonds within a molecule?

28
Infrared (IR) Spectroscopy
 Spectroscopy")
29
Infrared Spectroscopy Infrared radiation is absorbed by a molecule, resulting in vibrations (stretching or bending) of the bonds. A detector measures the energy that is transmitted.

30
IR Absorption by Molecules https://www.youtube.com/watch?v=xITzGUjong U

31
As you can see in the picture to the right, the radiation source beam is split by a mirror in order to pass through both the sample and the reference chambers. The light is reflected using mirrors into a monochromator (labeled splitter on the diagram) which only allows light of a single wavelength at a time to reach the detector. The detector receives the signals from both the sample beam and the reference beam. This information goes into the processor which translates the information into a plot with wavenumber on the x-axis and intensity on the y-axis. Intensity is measured as the percent transmittance of the IR radiation with respect to the reference. In other words, a 100% transmittance means that the sample absorbed the same amount of radiation as the reference.
 which only allows light of a single wavelength at a time to reach the detector. The detector receives the signals from both the sample beam and the reference beam. This information goes into the processor which translates the information into a plot with wavenumber on the x-axis and intensity on the y-axis. Intensity is measured as the percent transmittance of the IR radiation with respect to the reference. In other words, a 100% transmittance means that the sample absorbed the same amount of radiation as the reference..")
32
IR Spectroscopy Intensity is measured as the percent transmittance of the IR radiation with respect to the reference. In other words, a 100% transmittance means that the sample absorbed the same amount of radiation as the reference. A 0% transmittance means that the sample absorbed all of the radiation. The plot shows 100% trasmittance at the top and 0% at the bottom. The result is a plot with several peaks in the downward direction. These peaks correspond to frequencies of light that were absorbed by molecules because they matched the frequencies of the natural vibration of the molecular bonds. Some spectra will use absorbance values or reflectance values instead of % transmittance. The variables used will be chosen based on the desired goal of the study.

33
In what way might this be used?

Similar presentations


 –Fourier-Transform Infrared.>")


 3. High selectivity between molecular.>")

