Download presentation
Presentation is loading. Please wait.

1
PROTON MAGNETIC RESONANCE SPECTROSCOPY OF THE CENTRAL NERVOUS SYSTEM Dr. Hazem Abu Zeid Yousef Lecturer of Diagnostic Radiology. Assiut University.

2
INTRODUCTION Proton magnetic resonance spectroscopy is one such technique which provides a noninvasive method for characterizing the cellular biochemistry which underlies brain pathologies, as well as for monitoring the biochemical changes after treatment in vivo. It is considered as a bridge between metabolism and the anatomic and physiological studies available from MRI.

3
BASIC PRINCIPLES OF 1 HMRS 1 HMRS depends on a change in the resonance frequency of the nuclei within the molecules, regarding their chemical bonds, which is based on the chemical shift theory. The resonance frequency difference (chemical shift) is expressed as parts per million or ppm. The value of the chemical shift provides information about the molecular group carrying the hydrogen nuclei, and thus it provides differentiation among several metabolites.
 is expressed as parts per million or ppm. The value of the chemical shift provides information about the molecular group carrying the hydrogen nuclei, and thus it provides differentiation among several metabolites..")
4
TECHNIQUE OF MRS The 1 H-MRS acquisition usually starts with anatomical images, which are used to select a volume of interest (VOI), where the spectrum will be acquired. For the spectrum acquisition, different techniques may be used including single- and multi- voxel imaging using both long and short echo times (TE). Each technique has advantages and disadvantages and choosing the right one for a specific purpose is important to improve the quality of the results.
. Each technique has advantages and disadvantages and choosing the right one for a specific purpose is important to improve the quality of the results..")
5
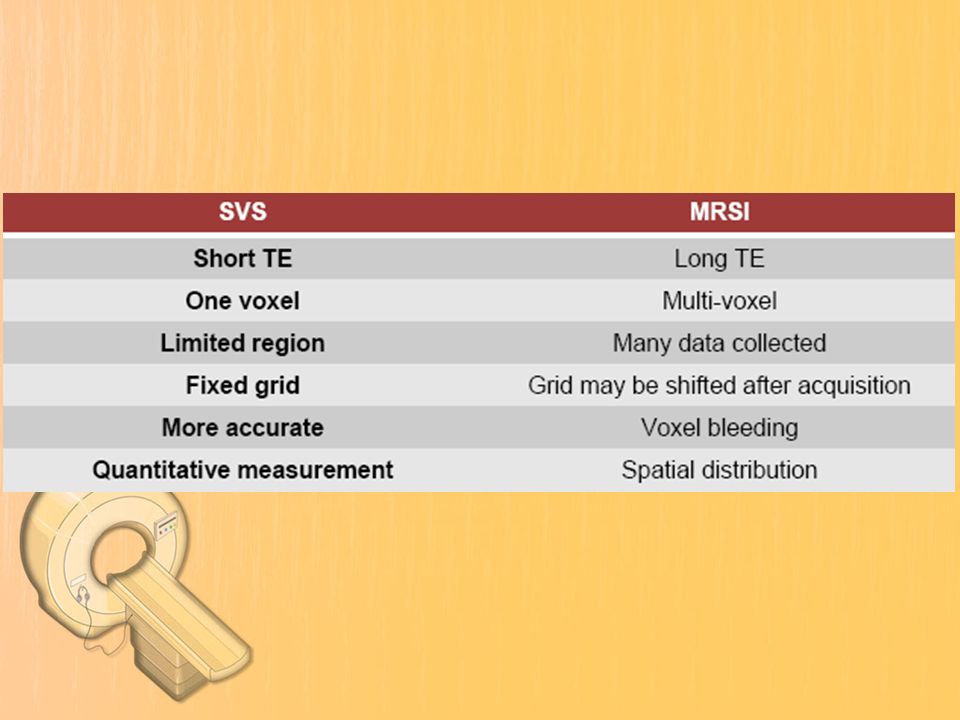
Single-Voxel Spectroscopy In the single voxel spectroscopy (SVS) the signal is obtained from a voxel previously selected. SVS acquires a spectrum from a small volume of tissue located at the intersection of three mutual orthogonal slice-selective pulses. The pulse sequence is designed to collect only the echo signal from the point where all three slices intersect.

6
The advantages of this approach are that: 1. the volume is typically well-defined with minimal contamination (e.g. extracranial lipids), 2. the magnetic field homogeneity across the volume can be readily optimized, leading to 3. improved water suppression and spectral resolution.
, 2. the magnetic field homogeneity across the volume can be readily optimized, leading to 3. improved water suppression and spectral resolution..")
7
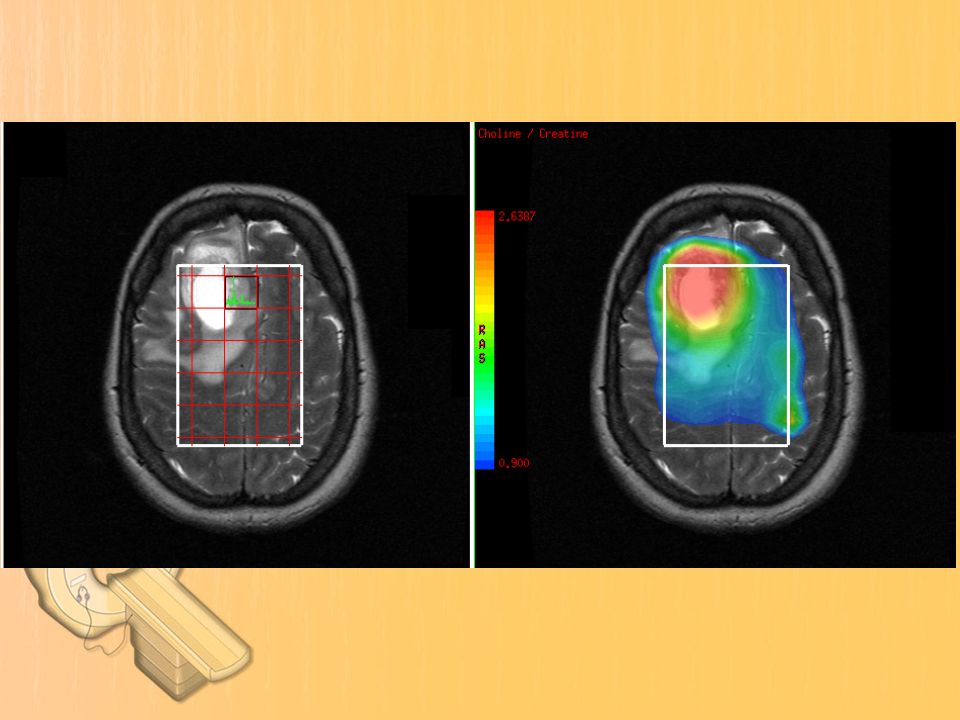
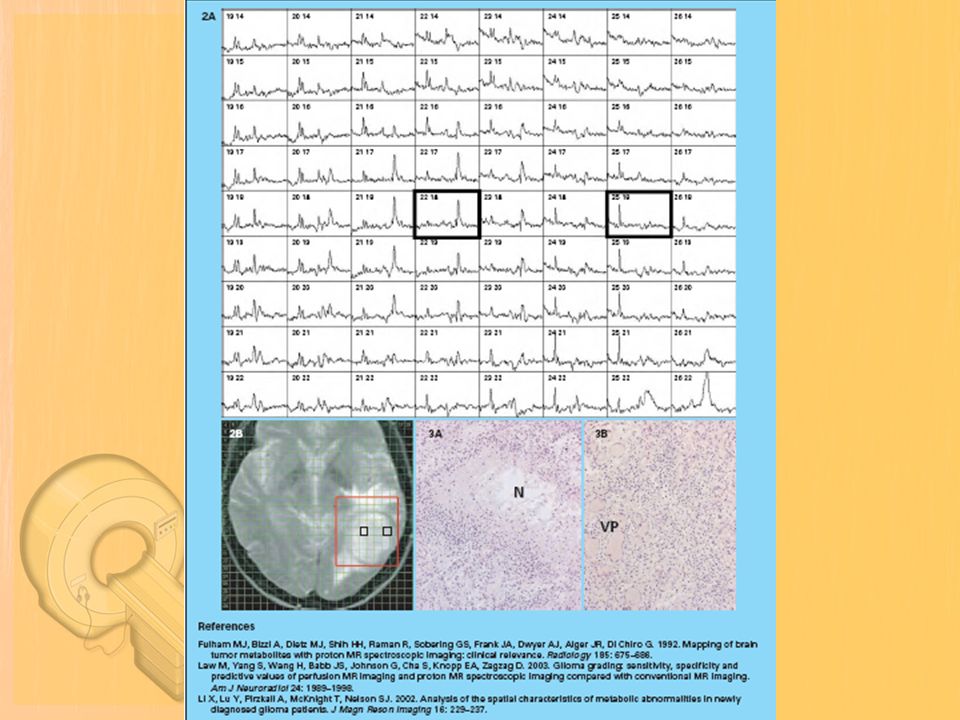
Magnetic Resonance Spectroscopy Imaging The main disadvantage of SVS is that it does not address spatial heterogeneity of spectral patterns and in the context of brain tumors. Magnetic resonance spectroscopy imaging (MRSI), also called chemical shift imaging, is a multi-voxel technique. The main objective of MRSI is to obtain many voxels and a spatial distribution of the metabolites within a single sequence.
, also called chemical shift imaging, is a multi-voxel technique. The main objective of MRSI is to obtain many voxels and a spatial distribution of the metabolites within a single sequence..")
9
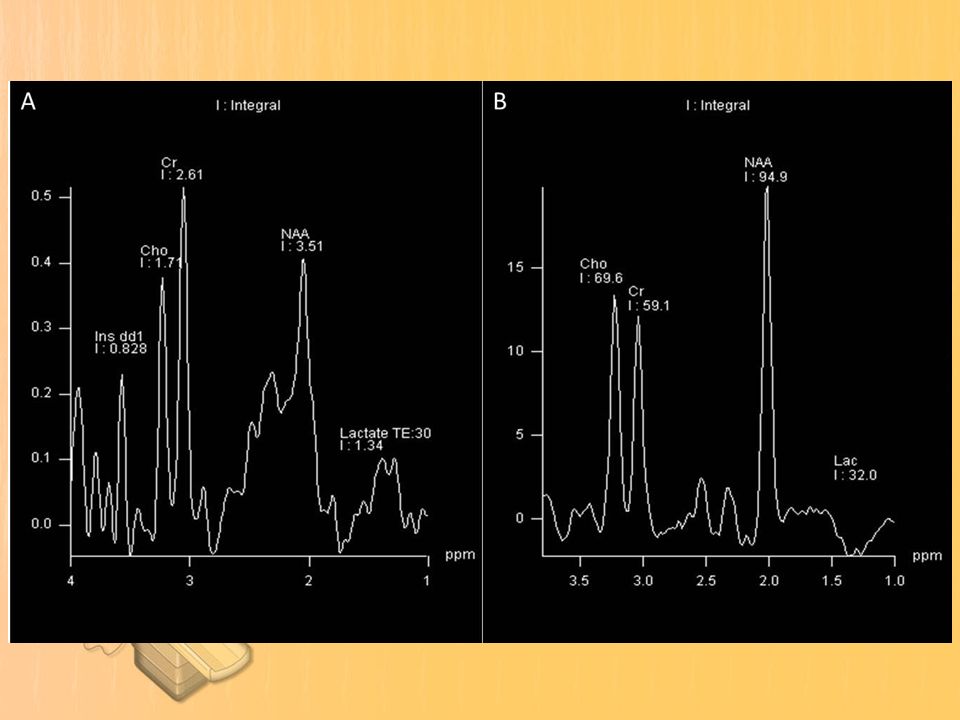
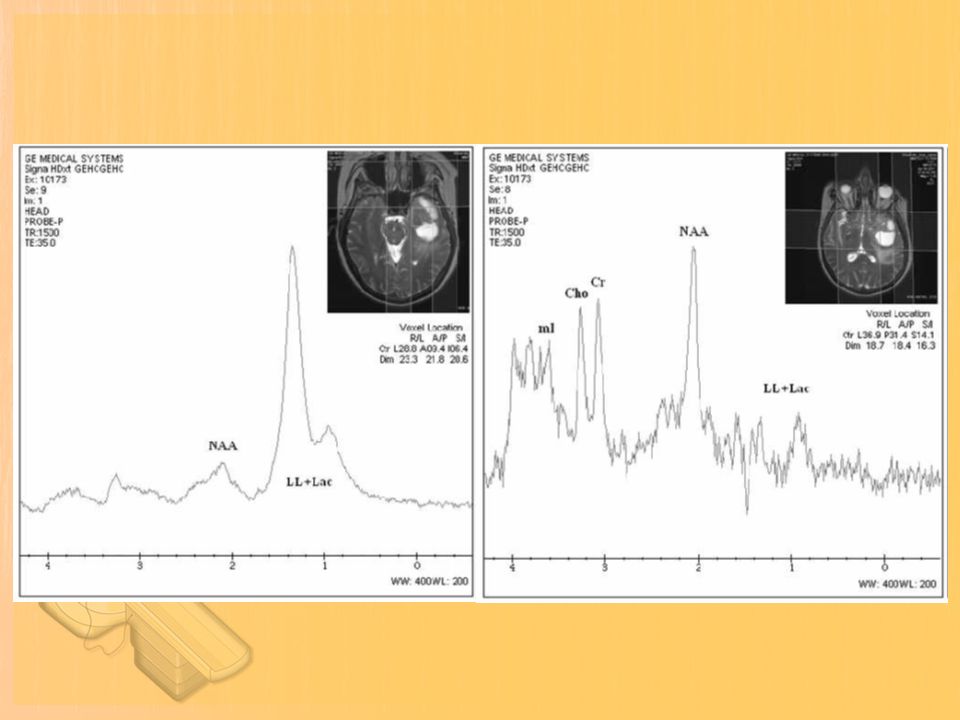
Short TE vs long TE MRS can be obtained using different TEs that result in distinct spectra. Short TE refers to a study in which it varies from 20 to 40 ms. It has a higher SNR. These short TE properties result in a spectrum with more metabolites peaks, such as myoinositol and glutamine- glutamate, which are not detected with long TE. Nevertheless, since more peaks are shown on the spectrum, overlap is much more common and care must be taken when quantifying the peaks of metabolites.

10
MRS spectra may also be obtained with long TEs, from 135 to 288 ms. Some authors describe 135- 144 ms as an intermediate TE. Long TEs have a worse SNR. Thus, the spectra are less noisy but have a limited number of sharp resonances. On 135-144 TEs the peak of lactate is inverted below the baseline. This has an important value since the peaks of lactate and lipids overlap in this spectrum. Therefore, 135-144 TEs allow for easier recognition of lactate peak as lipids remain above the baseline.

13
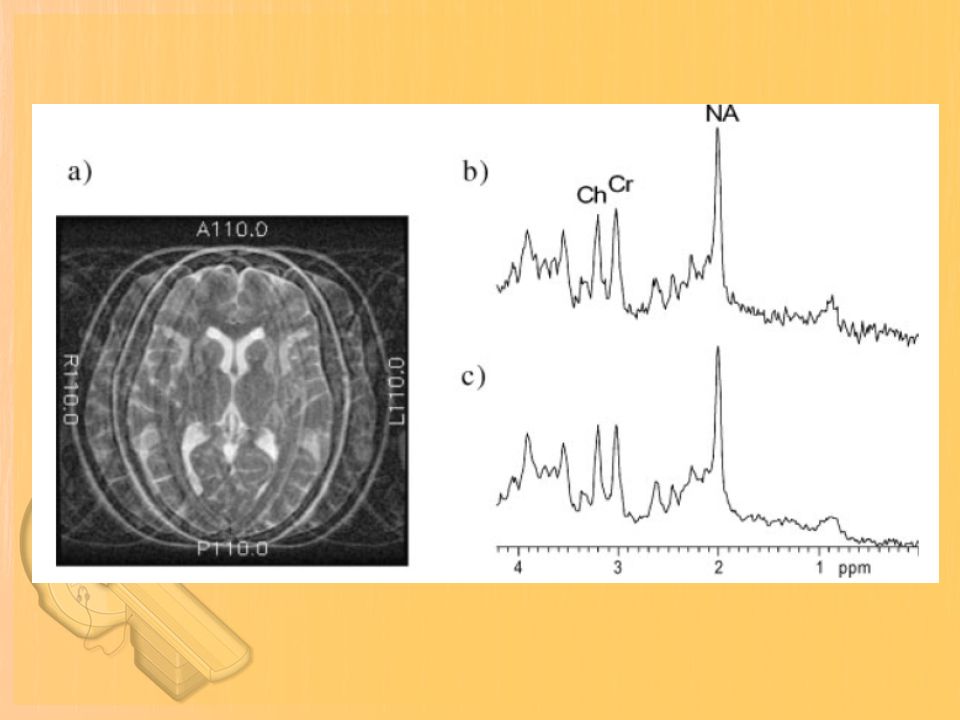
Artifacts MRS is prone to artifacts. Motion, poor water or lipid suppressions, field inhomogeneity, eddy currents, and chemical shift displacement are some examples of factors that introduce artifacts into spectra. Poor field homogeneity results in a lower SNR and broadening of the width of the peaks. For brain MRS, some regions are more susceptible to this artifact, including those near bone structures and air tissue- interfaces. Therefore placement of the VOI should be avoided near areas such as anterior temporal and frontal lobes.

14
Unfortunately, MRS is not like MRI where many artifacts are eye-catching. In MRS, pitfalls are at least as ubiquitous, but much less conspicuous. Furthermore, there is no agreement among experts on what exactly defines a good spectrum. When asked, how they judge the quality of their spectra, the most common answer from an expert will be: ‘it depends’.

17
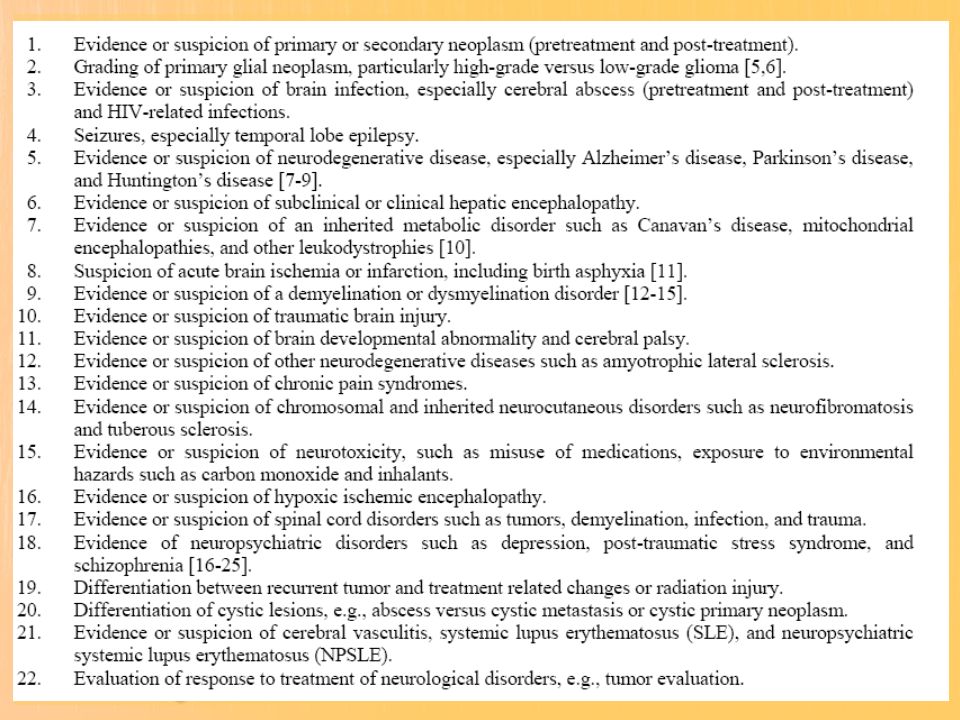
INDICATIONS FOR 1 H MR SPECTROSCOPY

19
CLINICAL APPLICATIONS OF 1 H-MRS Evidence or suspicion of primary or secondary neoplasm, pre-treatment and post-treatment. Grading of primary glial neoplasm, particularly high grade versus low grade. Differentiation between recurrent tumor and treatment related changes or radiation injury. Differentiation of cystic lesions e.g. abscess versus cystic metastasis or cystic primary neoplasm. Evaluation of response to treatment of neurological disorders.

20
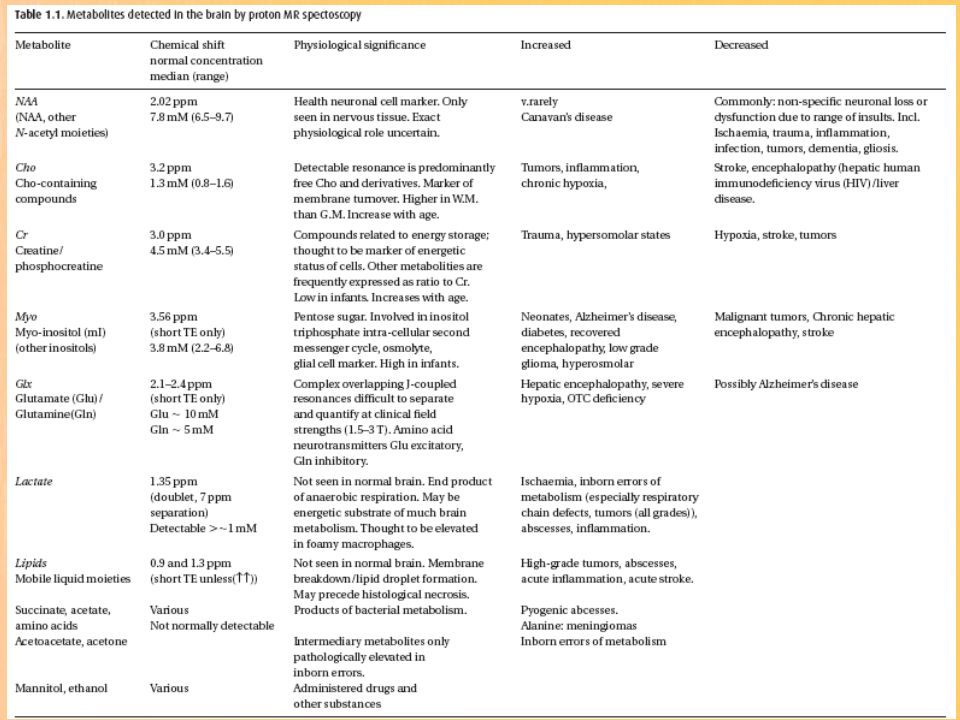
Neurospectroscopy biochemical features and their clinical significance Accurate classification of cerebral lesions by in-vivo 1H-MRS requires determination of the relationship between metabolic profile and pathologic processes. The assignment and clinical significance of the basic resonances in a spectrum as well as the less commonly detected compounds are discussed below:

22
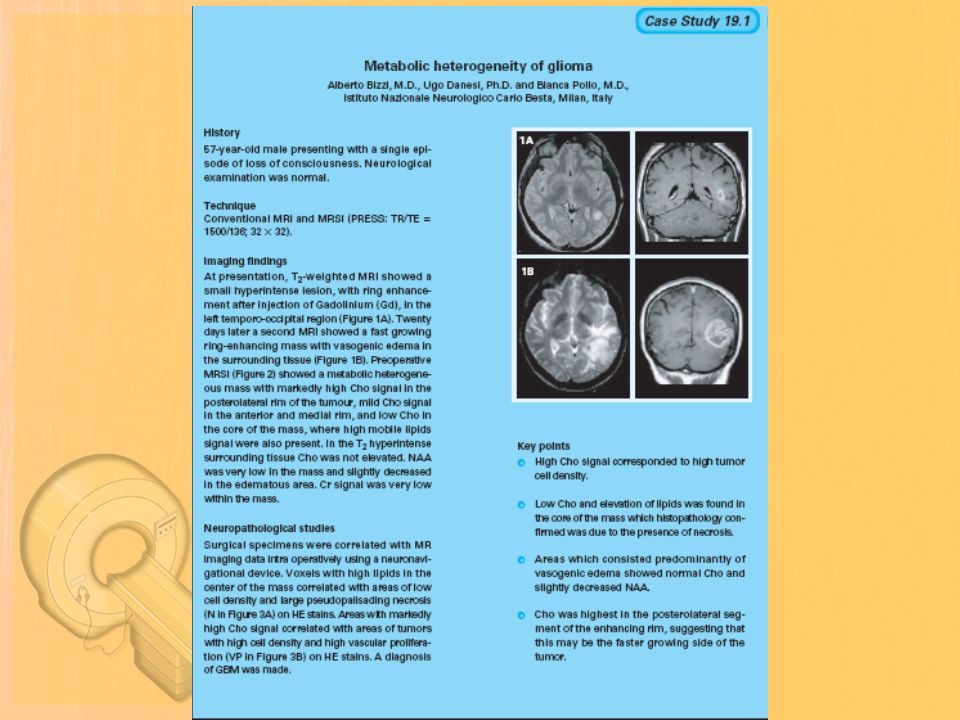
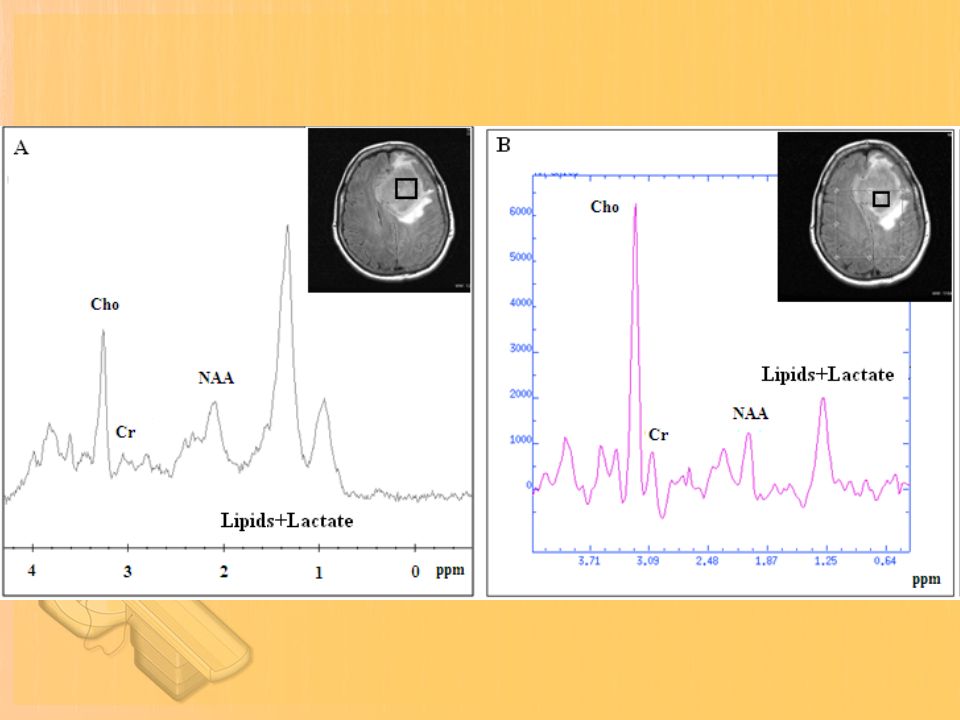
1 H SPECTROSCOPY OF BRAIN TUMORS It was found that nearly all brain tumors have decreased NAA signals, and often also have increased levels of Cho, leading to increased Cho/NAA ratios. The decrease in NAA is due to the loss, dysfunction or displacement of normal neuronal tissue. The Cho signal has been suggested that it is increased in brain tumors due to increased membrane turnover.

23
Other common metabolic changes in human brain tumors are elevated signals in the lactate and lipid and also sometime increased levels of mI in short TE spectra. The increase in lactate is mostly the result of anaerobic glycolysis. The elevated lipid levels is associated with necrosis and membrane breakdown. Increased levels of mI are believed to reflect increased numbers of glial cells, and in particular have been reported to be high in grade II gliomas. It has also been reported that patients with gliomatosis cerebri, even in the absence of increased Cho.

24
Tumor classification Two particularly important imaging diagnoses are the differentiation between high-grade and low-grade tumors, or between neoplastic and non-neoplastic lesions respectively. In astrocytomas, several studies, have suggested an association between tumor grade and Cho levels, with the higher grade tumors having greater Cho concentrations. This is consistent with the more aggressive tumors having higher membrane turnover and cellular density. However, some studies have found high-grade tumors (e.g. grade IV GBM) to have lower levels of Cho than grade II or grade III astrocytoma. This may be due to the presence of necrosis in high grade tumors.
 to have lower levels of Cho than grade II or grade III astrocytoma. This may be due to the presence of necrosis in high grade tumors..")
28
For discriminating solitary metastases from primary brain tumors, it has been suggested that investigation of peri-enhancing tumor regions may be useful; whereas gliomas are often invasive lesions which show elevated Cho in surrounding tissue, metastatic lesions tend to be more encapsulated and do not typically show high Cho signals or other abnormalities outside the region of enhancement. Moreover, in metastatic lesions there is almost no Cr peak identified, which is not the case in high grade gliomas.

30
1 H MR Spectroscopy of meningioma Meningiomas are common intracranial tumors and are generally easily diagnosed by their characteristic radiological imaging appearance of solid mushroom imaging pattern, extracranial location, dura matter conjunction and sinus involvement. However, 15% of meningiomas exhibit rim like enhancement, a prominent cystic component, hemorrhage, or even metaplasia, mimicking gliomas or cerebral metastatic tumors. 1 H-MRS has been proved useful in differentiating meningiomas with atypical radiologic pattern from other brain tumors

31
Alanine at 1.47ppm has been considered as the characteristic metabolic marker of meningiomas which differentiates them from other brain tumors. Nevertheless, reported occurrence of Alanine varies among different studies as it can significantly overlap with lactate resonance due to J-coupling effect.

32
In the absence of Alanine, several investigators aimed to correlate other metabolites to meningioma presence. Howe et al. found that low levels of mI and Cr were characteristic for meningiomas relative to grade II astrocytomas, anaplastic astrocytomas and glioblastomas [2003]. In the same study meningiomas revealed the highest Cho/Cr ratio among the other brain tumors, on both short and long TE. Another reported specific finding for meningiomas, is the absence of the neuronal marker NAA. Instead of partial volume effects, the peak of NAA at meningioma spectra, may also represent other endogenous NAA compounds

33
In another study of 31 meningioma patients (27 benign and 4 nonbenign meningiomas) that underwent SV 1 H-MRS were retrospectively analyzed. All meningiomas demonstrated increased choline and decreased creatine. Alanine and lactate coexisted in eight cases. They partially overlapped with each other and demonstrated a triplet-like spectral pattern. Glutamine/glutamate (Glx) was helpful for the recognition of meningioma when Ala was absent. N-acetyl compounds were observed in nine cases whose voxels were completely limited within the tumors, indicating that meningiomas might have endogenous NACs. Lac was indicative of an aggressive meningioma, although not always a nonbenign one.
 was helpful for the recognition of meningioma when Ala was absent. N-acetyl compounds were observed in nine cases whose voxels were completely limited within the tumors, indicating that meningiomas might have endogenous NACs. Lac was indicative of an aggressive meningioma, although not always a nonbenign one..")
34
1 H MR Spectroscopy of primary CNS lymphoma Primary central nervous system lymphoma (PCNSL) represents 1% of all brain tumors. Although densely contrast-enhancing lesions, without the presence of necrosis are characteristic imaging features of PCNS lymphoma, it can be difficult, sometimes even impossible, to distinguish PCNSLs from high grade gliomas on conventional MRI. Their differentiation, however, has important diagnostic and therapeutic implications.

35
The most specific finding for PCNSL on MRS is an increase in lipid and Cho resonances. Sometimes, lipid peaks in PCNSL may be more prominent than in high grade gliomas and can help differentiate between the two tumor types. Like high grade gliomas, the peritumoral area of PCNSLs demonstrates an abnormal metabolite pattern. Therefore, in the absence of obvious necrosis, increased lipid concentration together with a markedly elevated Cho/Cr ratio for both intratumoral and peritumoral areas may improve the distinction between PCNSLs and other brain tumors.

37
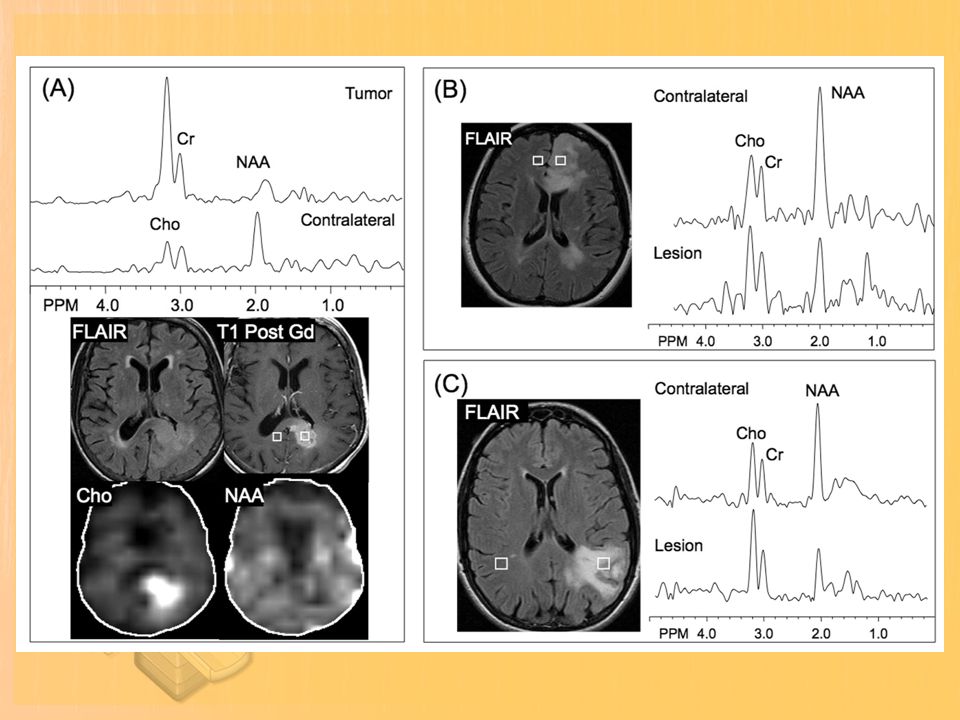
Tumors vs. non-neoplastic lesions Since tumors typically exhibit elevated Cho and decreased NAA, the greatest benefit of adding MRS to a clinical examination may be in including (or excluding) diagnoses with markedly different spectroscopic patterns, e.g. strokes, or focal cortical dysplasias. Differentiation between tumors and acute demyelinating lesions based on MRS alone, may be difficult as both typically present with elevated Cho and decreased NAA, and well as often increased lactate. Combination of conventional MRI with modern techniques of physiological imaging, in particular, perfusion MRI, can therefore improve the classification.
 diagnoses with markedly different spectroscopic patterns, e.g. strokes, or focal cortical dysplasias. Differentiation between tumors and acute demyelinating lesions based on MRS alone, may be difficult as both typically present with elevated Cho and decreased NAA, and well as often increased lactate. Combination of conventional MRI with modern techniques of physiological imaging, in particular, perfusion MRI, can therefore improve the classification..")
38
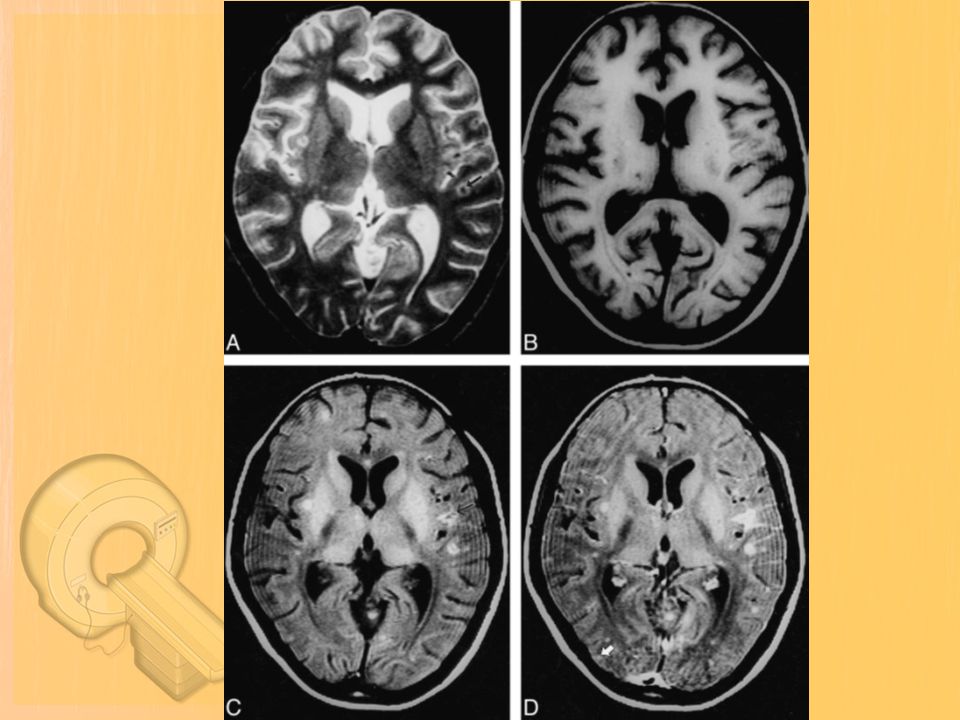
1 H MR spectroscopy in demyelination MR spectroscopy (MRS) is a sensitive technique for evaluating axonal damage (decreased NAA) and demyelination (increased Cho) and (mI) in multiple sclerosis (MS). Acute MS plaques usually show decreased NAA (and decreased (Cr) in large plaques) and increased Cho and lactate and, in short TE spectra, increased mI and lipids. Spectra from acute MS plaques “tumefactive demyelianting lesions” may be similar to those of neoplasms (elevated Cho, Lac, decreased NAA).
 in large plaques) and increased Cho and lactate and, in short TE spectra, increased mI and lipids. Spectra from acute MS plaques tumefactive demyelianting lesions may be similar to those of neoplasms (elevated Cho, Lac, decreased NAA)..")
39
As plaques resolve, Cr and Lac return quickly to normal, while Cho and lipids need months to return to normal. NAA may or may not recover to normal. Reduced NAA can be seen in normally appearing white matter in conventional T2 MRI appearance (NAWM). This correlates with clinical disability.
. This correlates with clinical disability..")
40
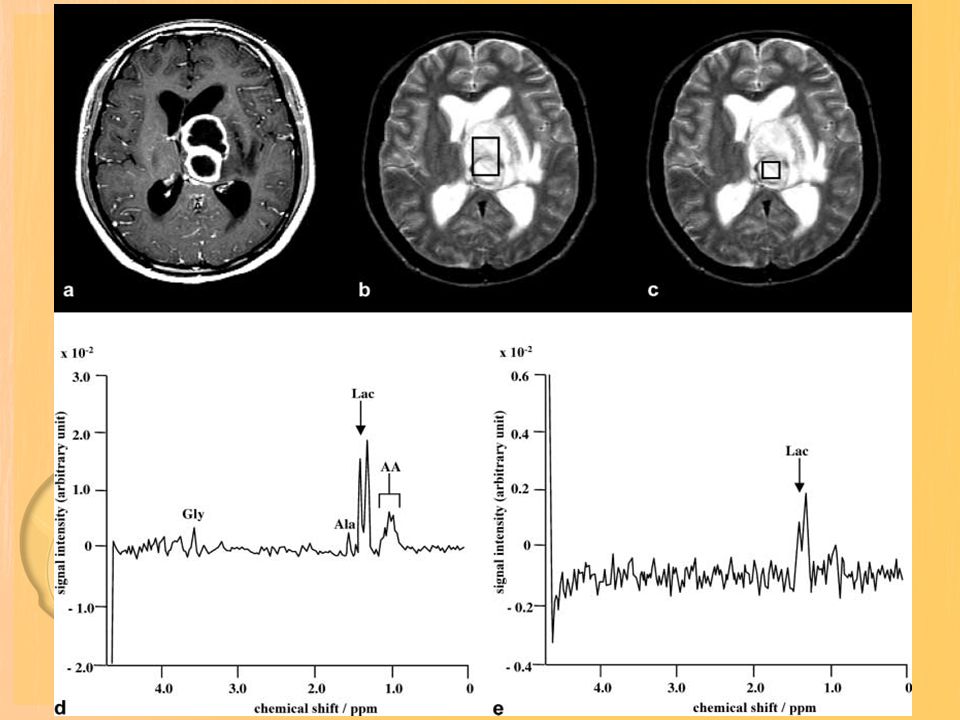
1 HMR spectroscopy in intracranial infection The fully developed mature abscess with central liquefactive necrosis appears as hypointense on T1W images and hyperintense on T2W images. The abscess rim appears iso- or slightly hyperintense on T1W and hypointense on T2W images, and shows rim enhancement on post-contrast T1W images. It is not always possible to differentiate pyogenic abscesses from other cystic intracranial mass lesions including tuberculous abscesses and neoplasms solely on the basis of MR features.

41
Cerebral abscesses contain no normal neurons and no membranous structures in their necrotic center. Therefore, no peaks of NAA, Cr, or Cho should be detected. A typical abscess spectrum shows the presence of cytosolic amino acids (leucine, isoleucine, and valine) which are the products of proteolysis caused by enzymes released from neutrophil cells. Because these metabolites have never been detected in neoplasms, their detection is strongly indicative of a cerebral abscess. Lactate is also detected in a large number of cerebral abscesses.
 which are the products of proteolysis caused by enzymes released from neutrophil cells. Because these metabolites have never been detected in neoplasms, their detection is strongly indicative of a cerebral abscess. Lactate is also detected in a large number of cerebral abscesses..")
42
Proton MR spectroscopy may also contribute in the identification of the causative organism of an abscess. Anaerobic microbial agents are characterized by the presence of lactate, cytosolic amino acids, alanine, acetate, succinate, and lipids. Aerobes and facultative anaerobes are characterized by the presence of lactate, cytosolic amino acids, and the occasional presence of lipids. Streptococcal abscesses are characterized by the presence of lactate, while Staphylococcal infections are associated with the presence of lipids and lactate.

43
Moreover, 1HMRS may contribute in the evaluation of the evolution and treatment response of a cerebral abscess. Sequential spectroscopic analysis of a brain abscesses may detect changes in the concentrations of the initially detected metabolites, providing thus a non-invasive methodology for evaluating the evolution of a cerebral abscess, and also its response to the administered antibiotic treatment.

45
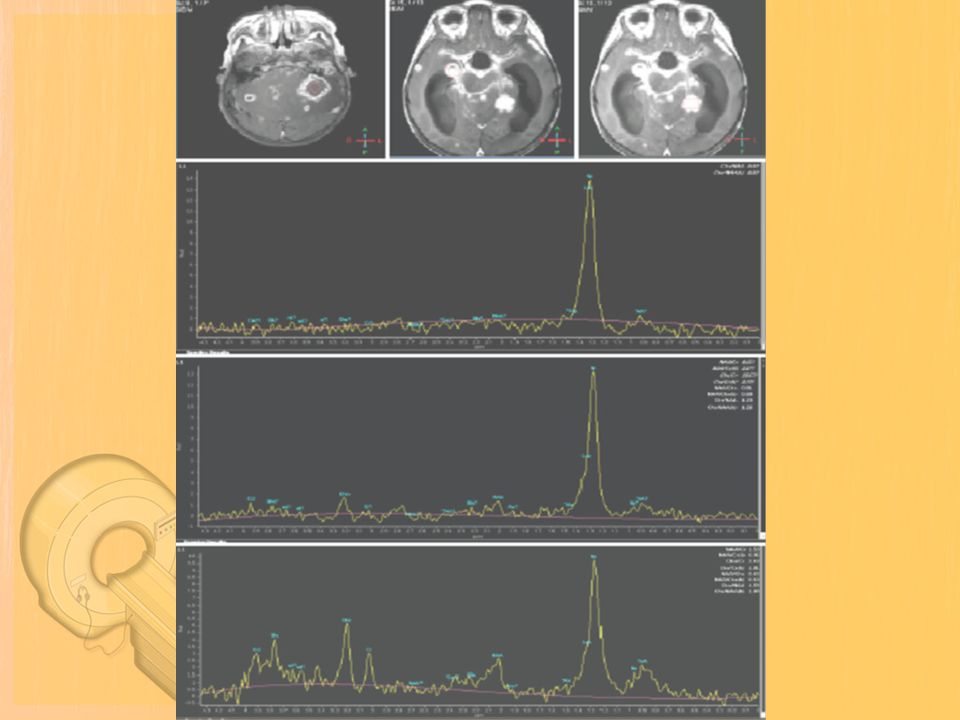
1 H MR spectroscopy of tuberculoma On MRI, a tuberculoma’s appearance varies depending upon its stage of maturation, i.e. whether non-caseating, caseating with solid center, or caseating with a liquid center. The non-caseating tuberculoma usually appears as hyperintense on T2W and slightly hypointense on T1W images; metastases, lymphoma, and other infective granulomas also have similar imaging features. On MTI, the cellular components of the lesions appear brighter and relatively specific for the disease. In addition, lesion conspicuity is greater on T1W MTI compared to conventional SE imaging.

46
The solid caseating tuberculoma appears iso- to hypointense on both T1W and T2W images. This T2 hypointense appearing solid caseation often overlaps with imaging features of lymphoma, glioblastoma, fungal, and cysticercus granulomas. On T1W MT images, the solid center appears hypointense with hyperintense rim. When the solid center of caseating lesion liquefies, the center appears hyperintense with a hypointense rim on T2W images. On T1W and T2W MT images, the rim appears hyperintense and undergoes contrast enhancement on post-contrast study.

48
Elevated lipid peaks within the tuberculous lesions as identified by 1 H-MRS permitted to discriminate between tuberculous and non-tuberculous brain lesions. The cell wall of mycobacteria is predominantly composed of lipids in contrast to that of other bacteria. The lipid resonances at 0.9 and 1.3 ppm are generated by the methylene and terminal methyl groups, respectively, of fatty acids contained in the caseous material. Moreover, there is a relative lack of proteolytic enzymes in the tuberculous inflammatory exudates as compared with pyogenic inflammation.

50
1 H MR spectroscopy of epilepsy 1 H-MRS aids in the localization or lateralization of the epileptogenic foci. Temporal lobe epilepsy (TLE) associated with hippocampal sclerosis (HS) is the most common refractory focal epilepsy. The localization is performed by the comparison of metabolites on the left and right temporal lobe, especially in the hippocampus and temporal poles. The metabolites of interest in epilepsy are NAA, GABA and glutamine/glutamate (Glx) and the less prominent mI and lactate. Most of the studies demonstrate decreased levels of NAA in the affected temporal lobe, with no changes or mild increases of tCho. Unilateral presence of lactate in the mesian temporal lobe could also be indicative of the side of the epileptogenic zone.
 associated with hippocampal sclerosis (HS) is the most common refractory focal epilepsy. The localization is performed by the comparison of metabolites on the left and right temporal lobe, especially in the hippocampus and temporal poles. The metabolites of interest in epilepsy are NAA, GABA and glutamine/glutamate (Glx) and the less prominent mI and lactate. Most of the studies demonstrate decreased levels of NAA in the affected temporal lobe, with no changes or mild increases of tCho. Unilateral presence of lactate in the mesian temporal lobe could also be indicative of the side of the epileptogenic zone..")
51
Additionally, 1H-MRS studies of TLE have also been focused on mI, however, its role remains controversial. Difference of mI levels between the seizure focus (temporal lobe) where mI is increased, and areas of seizure spread (frontal lobe) where mI is decreased. Thus, 1H-MRS may aid to the distinction of primary epileptogenic brain damage from seizure secondary effects on adjacent normal brain and help to distinguish drug refractory TLE patients, who will benefit from surgery by predicting postoperative outcome.
 where mI is increased, and areas of seizure spread (frontal lobe) where mI is decreased. Thus, 1H-MRS may aid to the distinction of primary epileptogenic brain damage from seizure secondary effects on adjacent normal brain and help to distinguish drug refractory TLE patients, who will benefit from surgery by predicting postoperative outcome..")
52
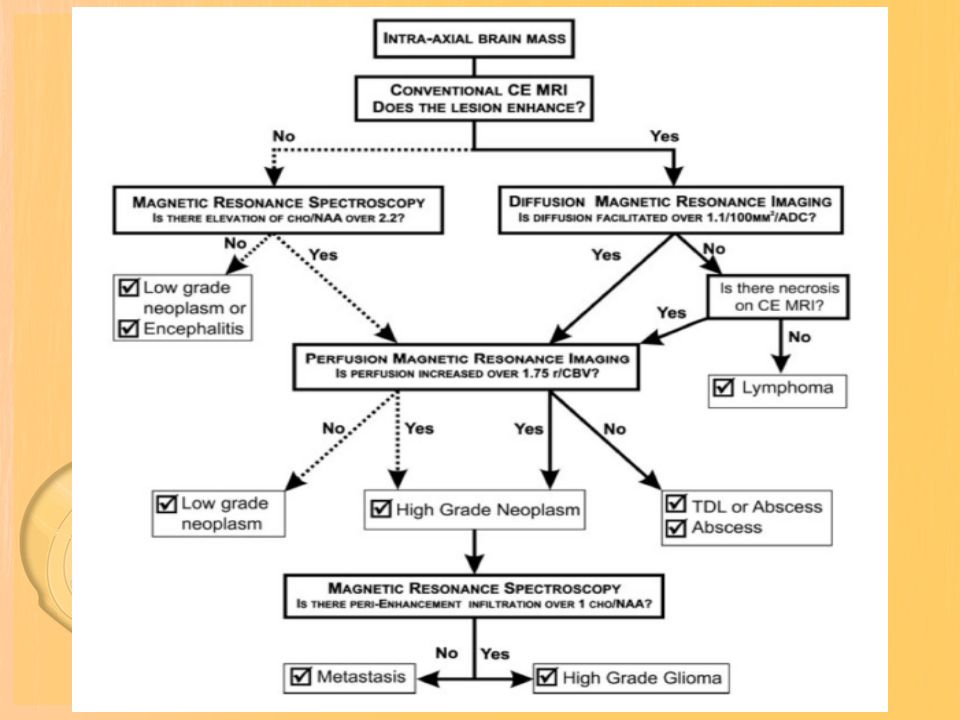
A practical MRI-based algorithm including results from post-contrast MRI, diffusion-weighted MRI, perfusion MRI, and 1H MRSI was proposed to improve the diagnosis and classification of these lesions (Al-Okaili et al. RadioGraphics 2006). The diagnostic strategy was evaluated based on 40 patients who had complete data from all included imaging modalities; to differentiate between tumors and non-neoplastic lesions, the accuracy, sensitivity, and specificity of the classification strategy was 90%, 97%, and 67%. These results suggest that integration of advanced imaging techniques with conventional MRI may help to improve the reliability of the diagnosis and classification of brain lesions.
. The diagnostic strategy was evaluated based on 40 patients who had complete data from all included imaging modalities; to differentiate between tumors and non-neoplastic lesions, the accuracy, sensitivity, and specificity of the classification strategy was 90%, 97%, and 67%. These results suggest that integration of advanced imaging techniques with conventional MRI may help to improve the reliability of the diagnosis and classification of brain lesions..")
54
1H-MRS can provide important in vivo metabolic information, complementing morphological findings from conventional MRI in the clinical setting. This technique is an extremely valuable tool in solving difficult neurological cases and increase confidence in diagnosis; however, it should be always considered a supplementary tool to the patients’clinical history, examination, and conventional MRI when reaching the final diagnosis.

Similar presentations