Download presentation
Presentation is loading. Please wait.

1
Neuroimaging with MRI: combining physics and physiology to understand brain function Rhodri Cusack

2
Nuclear magnetic resonance Nuclei are small magnets Lower energy when aligned with field –Radio frequency (RF) energy can knock them out of alignment –As they revert, emit RF Simple relationship between field strength (B 0 ) and RF frequency –Quantum mechanics -> only exact frequency will do magnetic field radio frequency (RF) energy
 energy can knock them out of alignment –As they revert, emit RF Simple relationship between field strength (B 0 ) and RF frequency –Quantum mechanics -> only exact frequency will do magnetic field radio frequency (RF) energy")
4
Magnetic resonance imaging Clever bit: working out which bit of signal came from where Different tricks for each of three dimensions All based on applying “gradients” in magnetic field gradient in magnetic field radio frequency (RF) energy
 energy")
5
MRI: “pulse sequences” RFRecord Gradient in z Gradient in x Gradient in y Spin echo; Gradient echo

6
Potential dangers & annoyances Magnetic field RF Gradients

7
Two different MRI acquisitions Structural image (“Anatomical”, “T1”, “SPGR”) Resolution 1x1x1mm; 256x256x256 voxels T1 weighted for contrast between grey and white matter. Spin-echo. 12 minutes Functional (“T2*”, “EPI”,”BOLD”) Typically 4x4x5mm; 64x64x21 voxels T2* weighted gradient-echo for contrast between active and resting states 1.1 seconds
 Typically 4x4x5mm; 64x64x21 voxels T2* weighted gradient-echo for contrast between active and resting states 1.1 seconds.")
8
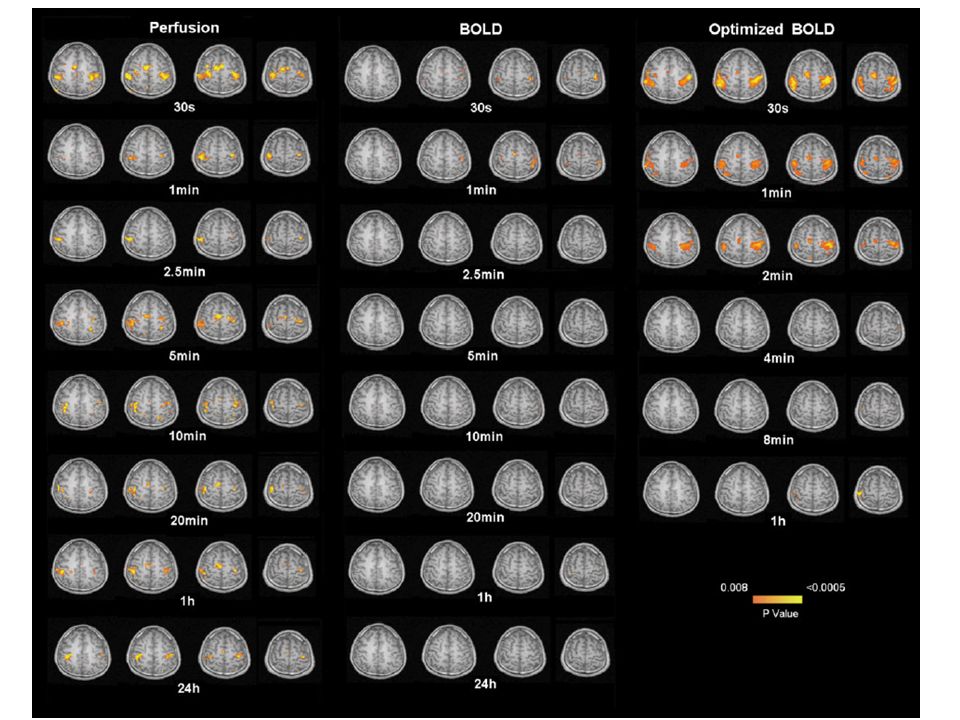
Detecting function Oxygen contained in oxy-haemoglobin in arteries used by spiking and other metabolic processes Veins contain deoxy-haemoglobin –Has different magnetic properties to oxy-haemoglobin, and to tissue –Introduces inhomgeneities in magnetic field which cause reduction in MRI signal –Reduction especially large for T2* weighted gradient echo sequences With Shaihan Malik

9
Detecting function When a brain region is active: –Blood flow increases –Veins increase in size –Extra blood supply is greater than use, so amount of deoxy- hemoglobin actually reduces Net effect is a reduction in field inhomogeneity, and an increase in MR signal “BOLD” effect – not simple

10
FMRI: experimental design Acquire one image every 1.1s Typical experiment –30 mins long – around 1600 images –blocks of around 30 secs AA ABB time hemodynamic response “block design”

11
O’Craven & Kanwisher (2000)
")
12
Hemodynamic response function

13
Event-related design Events Predicted HDR time (s) Advantages Psychological disadvantages of blocking trials. Essential for some designs (e.g., oddball) Post hoc/ subjective classification Other models Add temporal derivative; dispersion Fourier basis sets FIR
 Post hoc/ subjective classification Other models Add temporal derivative; dispersion Fourier basis sets FIR.")
14
Henson et al (1999)
")
15
Factors affecting efficiency of design Temporal autocorrelation –Noise in MRI is autocorrelated: datapoints close in time have more similar noise values Haemodynamic response –This smoothes higher frequency components in design Adaptation Low frequency drift

17
Efficiency of design Most efficient design depends on contrast Block design more efficient than event related –Two conditions:12 seconds on/ 12 seconds off –Mechelli, Price, Henson, Friston (2003)
")
18
FMRI analysis: “preprocessing” stages Slice timing –different slices in the head are acquired at different times –can correct for this by interpolating across time Motion correction –subjects usually move a little over the course of the session –this introduces a strong artefact unless corrected for Undistortion

19
Artefacts in EPI: Fields should be flat Different materials act to strengthen or weaken magnetic fields Ideally, field should be homogeneous –Easy to arrange when it is empty, but ruined as soon as a head is put in

20
00.27-0.27 Field strength relative to 3 Tesla (parts per million)
")
21
Field inhomogeneity artefacts: dropout

22
Field inhomogeneity artefacts: distortion

23
FMRI analysis – further preprocessing Normalisation –heads are different shapes and sizes –we wish to compare similar brain regions across subjects –non-linear warping to common space Smoothing –makes data normal through time

24
FMRI analysis: statistical model Multiple regression model to partition components –predicted HDR for each e.g., visual stimulus; motor response; novelty detection –sometimes also “movement parameters” t-test or F-test –Within a subject (“fixed effects, FFX”) –Across subjects (“random effects, RFX”)
 –Across subjects ( random effects, RFX )")
25
Multiple comparisons problem Separate statistical test is being performed for each voxel –“mass univariate” Lots and lots of these –By chance, very likely that some of them will come out significant Bonferroni correction excessively conservative Gaussian Field Theory –Independently developed by some Russian submarine scientists, and Worsley & Friston –Activation tends to be clustered together can allow lower threshold if lots of voxels in one region have a shift –“corrected” p-values

26
O’Craven & Kanwisher (2000)
")
27
Common software SPM from FIL, London –Most common tool worldwide –Default at CBU; most people script with “aa” –Current version SPM 5 FSL (“fossil”) from FMRIB, Oxford –Latest version 4 –Fast, useful extra tools (e.g., MELODIC ICA analysis) BrainVoyager – commercial –Often used for flat mapping AFNI – Robert Cox –More widespread in US
 from FMRIB, Oxford –Latest version 4 –Fast, useful extra tools (e.g., MELODIC ICA analysis) BrainVoyager – commercial –Often used for flat mapping AFNI – Robert Cox –More widespread in US")
28
Further imaging techniques Adaptation –Reduction in response for repeated stimuli –Can test whether two tasks (A, B) both recruit the same neuronal population within a voxel AA vs. AB or BA MVPA: correlation in spatial patterns DTI

29
Haxby et al (2001)
")
30
Being critical Imaging experiments are expensive to run –Around £10 000 per study Brain imaging is hard –Hard to design the right task Our knowledge of the brain is often crude –Scanners are hard to set up and frequently fail in complex ways –Analysis is complicated, and takes a long time Scientists are reluctant to throw away data –Temptation to reanalyze until something works –Re-interpret original hypotheses –Not as alert as should be to potential artefacts Be sceptical –Watch p-values; group studies, random effects most reliable –Look for confirmation across studies

31
Running an imaging study at the CBU Consult the guide on the wiki Academic review –Present to your group –Present at the Imaging Interest Group meeting –Apply to Imaging Management Committee for slots Leave time for practicalities –LREC –Insurance –Setting up your experiment –Running a behavioural pilot

Similar presentations

>")


 Juha Salmitaival.>")


 quantum property of protons energy absorbed when precession frequency matches radio frequency.>")


 Magnetic Fields>")


