Download presentation
Presentation is loading. Please wait.

2
Session Objectives Decode the Teacher Summative Evaluation form, including the Student Achievement Measures, so it can be used to give teachers feedback. Practice giving actionable feedback to teachers in different situations on their Summative Evaluation. Receive pointers on giving actionable feedback to teachers on their Summative Evaluation

4
2014-2015 District and Charter Plans Each District and Charter School selected their Student Achievement Measures and their Multiple Measures for 2014-15 in Summer 2014. Student Achievement Measures Choices SBA or EOC or Both Multiple Measures Choices Domain 1 + 4 AND: Student Survey, Parent Survey, or Teacher Attendance

5
Turn to page 4 in your workbook – the example summative report As we go through the components of the report, highlight, mark- up, make notes, etc. about the different areas and what they mean This will act as a guide for the feedback activity later

7
Student Achievement Multiple Measures Observations

8
Levels of Educator Effectiveness Chart Category Subtotals and Total Evaluation Score Effectiveness Level

9
Strengths and Weaknesses Next Steps Block Signature Lines

10
Put a box around the Tag Put a box around the Grade Level and Teacher Group

11
Teacher Group Group A – Tested subject areas and grades Group B – Non-tested subject areas and grades Group C – Pre-K, Kindergarten, 1 st, 2 nd Group D – Not documented in Teachscape

12
Graduated Consideration Tag Tags identify which formula calculation was applied Tags are numbered 1-12

13
Deeper Dive into Graduated Considerations for 2014-15 Pages 11-12 in your workbook

14
Graduated Consideration Tag

16
Deeper Dive into Student Achievement Measures for 2014-15

17
What Are Student Achievement Measures (STAM)? STAM can account for up to 50% of the teacher evaluation score It is a measure of how far a student has progressed in their learning over time Examples of STAM DIBELS Developmental Reading Assessment SBA (PARCC in 2016) ACCESS MAP Interim Assessment Riverside Interim Assessment
 ACCESS MAP Interim Assessment Riverside Interim Assessment.")
18
What Are Student Achievement Measures (STAM)? Student achievement growth is the most reliable measure of the impact an individual teacher has on students. STAM are used in calculating Value Added Model (VAM) scores
 scores.")
19
VAS and PARCC The data used to calculate VAS is based on scores from the three prior years of instruction. 2015 VAS will use scores from 2014, 2013 and 2012 2016 VAS will use scores from 2015, 2014 and 2013 PARCC data will not be used in calculating scores until spring of 2015-16.

20
What does Value Added mean? Value added models use each student’s individual prior performance to form expected achievement that is compared to actual achievement.

21
VAM vs. VAS The Value Added Model (VAM) is the method used to calculate the Value Added Score (VAS).
 is the method used to calculate the Value Added Score (VAS)..")
22
201220132014 The same students’ scores are averaged for three years.

23
VAM – How Might it Work? Teacher 5th Grade Math SS Teacher A30.6 Teacher B36.9 Teacher C32.9 Teacher D27.1 These are real math data from four New Mexico 5 th grade teachers. Which teacher is effective?

24
ABCDE Teacher 5 th Grade Math (SS) State Proficiency Difference (A - B) State Average Difference (A - D) Teacher A30.640-9.437-6.4 Teacher B36.940-3.137-0.1 Teacher C32.940-7.137-4.1 Teacher D27.140-12.937-9.9 VAM – How Might it Work? Measuring current performance to state proficiency or state average.

25
VAM – How Might it Work? Teacher 5th Grade Math Free/Reduced Lunch % Mobile %ELL %SWD % Teacher A30.6100%29%54%11% Teacher B36.9100%28%32%4% Teacher C32.9100%33%30%11% Teacher D27.1100%10%70%100% Each teacher has a unique set of students. Teachers should only be evaluated on their contribution to student learning, not on factors outside of their control.

26
VAM – How Might it Work? FGHIJK Teacher State Non-ELL Average Mean Non-ELL Difference (G - F) State ELL Average Mean ELL Difference (J - I) Teacher A38.532.9-5.630.028.6-1.4 Teacher B38.539.30.830.030.50.5 Teacher C38.533.3-5.230.032.02.0 Teacher D38.528.0-10.530.026.8-3.2 Measuring current performance to sub-group state means.
 State ELL Average Mean ELL Difference (J - I) Teacher A Teacher B Teacher C Teacher D Measuring current performance to sub-group state means..")
27
VAM – How it Does Work AMN Teacher 5 th Grade Math (SS) Prior Two Years+ Ave Scale Score Difference (A -M) Teacher A30.632.70-2.1 Teacher B36.936.000.9 Teacher C32.934.40-1.5 Teacher D27.116.1011.0 Context is unique to each student – which is what using prior performance does.
 Prior Two Years+ Ave Scale Score Difference (A -M) Teacher A Teacher B Teacher C Teacher D Context is unique to each student – which is what using prior performance does.")
28
Average Scale Score Trajectory 3 rd Grade 340 4 th Grade 440 5 th Grade 540

29
Average Scale Score Trajectory 3 rd Grade 320 4 th Grade 425 5 th Grade 530

30
Average Scale Score Trajectory 3 rd Grade 320 4 th Grade 405 5 th Grade 520

31
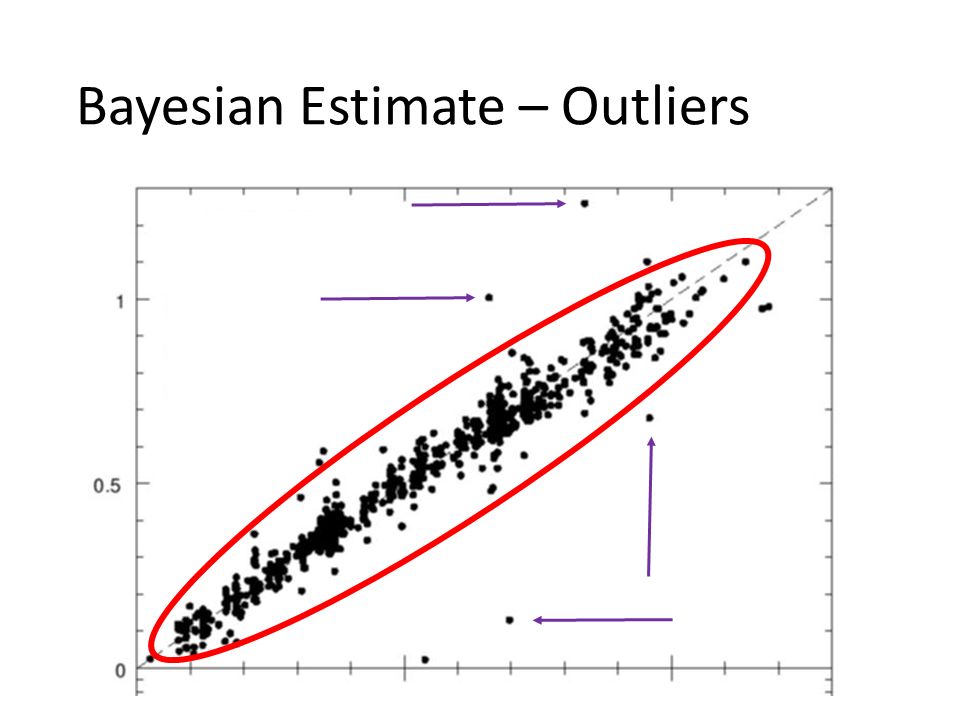
Bayesian Estimate – Outliers

33
VAS Ranges Exemplary1.67+ Highly Effective0.67 to 1.67 Effective-0.67 to +0.67 Minimally Effective-1.67 to -0.67 Ineffective<-1.67

34
AreaMeasure Points Possible SBA 2011SBA 2012SBA 2013 Avg. 3 years VAS Score Final Score STAM 1 SBA70 Avg. Math SS = 36.18 Avg. Prior SS = 36.25 Diff. = -.07 Avg. Math SS = 40.86 Avg. Prior SS = 40.81 Diff. =.05 Avg. Math SS = 40.27 Avg. Prior SS = 38.46 Diff. = 1.81 Avg. SS = 39.10 Avg. Prior SS = 38.51 Diff. = +.59 2.10 185.41 STAM 2 Q1 Growth 10 STAM 3 SGGELL5 Obs Domains 2&3 65 MM 1 Domains 1&4 30 MM2 St. Survey20 Teacher A VAS is 2.10 VAS is Exemplary

35
AreaMeasure Points Possible SBA 2011SBA 2012SBA 2013 Avg. 3 years VAS Score Final Score STAM 1 SBA70 Avg. Math SS = 42.97 Avg. Prior SS = 44.71 Diff. = - 1.74 Avg. Math SS = 42.02 Avg. Prior SS = 44.36 Diff. = -2.34 Avg. Math SS = 43.89 Avg. Prior SS = 42.95 Diff. = +0.94 Avg. SS = 42.89 Avg. Prior SS = 44 Diff. = - 1.11 -.19 119.02 STAM 2 EOC0 Obs Domains 2&3 65 MM 1 Domains 1&4 39 MM2Tchr Att26 Teacher B VAS is -0.19 VAS is Effective

36
Educator Effectiveness System – Teacher VAS Results Course VAS 2011 VAS 2012VAS 2013N Students Course Overall VAS Course VAS Class Algebra I-1.798+.7362 130-.8040 Min. Effective Geometry-1.488 46-1.488 Min. Effective Algebra II-.1180-.2326-1.184132-.4268Effective ELA 10 -1.022+.208950-.8996 Min. Effective Post Algebra II Math -.5566+.6558+.435634.22152Effective Chemistry -.0061-.844423-.5528Effective Physical Science +.9584+.639942.91293Highly Eff. ELA 11-.4052 45-.4052Effective Algebra II-1.742 16-1.742Ineffective Physics +.4868 3 Insuff. Data Geometry-1.338-2.753-.3162148-1.043Min. Effective

37
Focus on Feedback 2 Types of Feedback Point in Time Feedback Snapshot view of classroom lesson Wows & Wonders Pre and Post Observation Summative Evaluation Feedback Overall view of year of instruction Given end of year after effectiveness scores are calculated using all measures

38
Linda M. Paul, Ed.D. linda.paul@nmsli.org (505) 277-0182 New Mexico School Leadership Institute
 New Mexico School Leadership Institute")
Similar presentations


 Curt Nath Director of Curriculum Ocean City School District.>")


>")

 20%>")

 20%>")


