Download presentation
Presentation is loading. Please wait.

1
Tools for displaying public health information Based on presentation created by Helen Cooke SWPHO Delivered by Isobel Perry, Senior Public Health Intelligence Analyst, SEPHO

2
Health Profiles APHO Inequalities Toolkits –Internal inequalities in all Local Authorities Prevalence models Commissioning toolkits –JSNA tools –Floor Targets Interactive Local data resources What we will cover in this session

3
For each model: Understand its purpose Understand the main ways you can use it Understand its strengths and weaknesses Understand how it might help your organisation

4
Health Profiles Compact 4-page document or electronic Local Authority level SOA level deprivation Trends Ethnicity 32 indicators on wider determinants Interpretation provided Also visualised through Instant Atlas

5
Income inequalities

10
Some of the indicators

11
Health Profiles - examples Hastings Tunbridge Wells

12
APHO Health Inequalities intervention tool Prevalence models Hospital Episode Statistics (HES) interactive maps
 interactive maps")
13
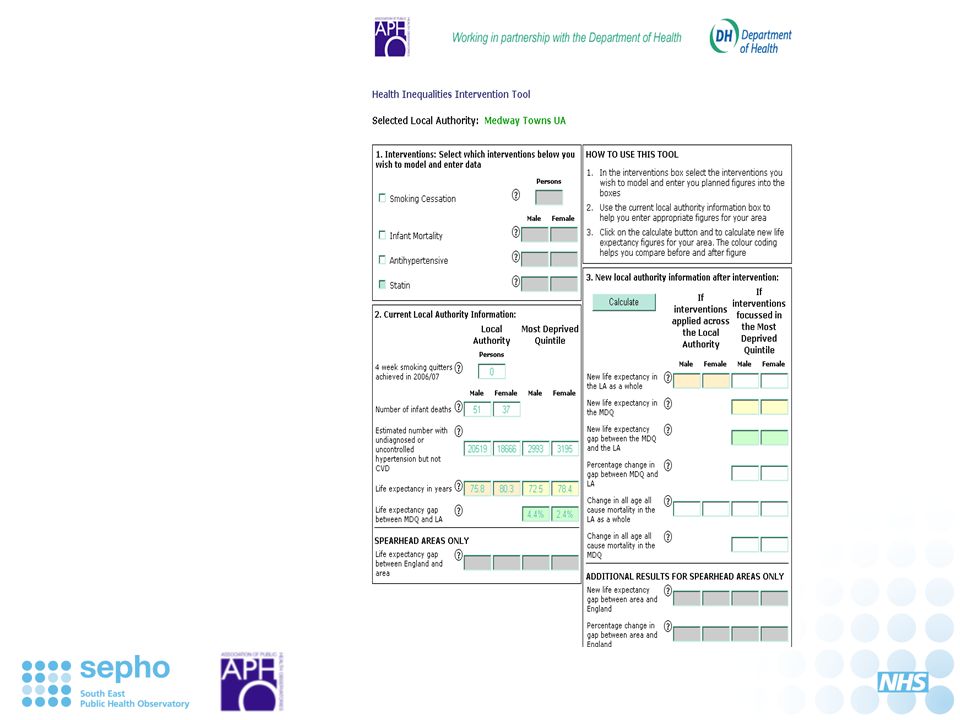
Inequalities Intervention Tool for local authorities This tool provides information on the following: ● The current life expectancy in English local authorities ● The current gap in life expectancy between the local authorities and England ● A breakdown of the causes of the life expectancy gap by disease type and age It allows local authorities to estimate the effect on their life expectancy gap if certain interventions are increased, specifically: ● Interventions to reduce infant mortality ● Smoking cessation ● Antihypertensive prescribing in people without diagnosed cardiovascular disease ● Statin prescribing in people without diagnosed cardiovascular disease These interventions are chosen because they can be influenced by PCT and LA commissioning http://www.lho.org.uk/HEALTH_INEQUALITIES/Health_Inequalities_Tool.aspx

15
Spearhead Group areas Local Authority Districts

16
Breakdown of life expectancy gap between the Most Deprived Quintile (MDQ) of Medway Towns UA and the least deprived quintile in the local authority by cause of death
 of Medway Towns UA and the least deprived quintile in the local authority by cause of death")
17
Life expectancy years gained if the Most Deprived Quintile (MDQ) of Medway Towns UA had the same mortality rate as the least deprived quintile in the local authority for each cause of death.
 of Medway Towns UA had the same mortality rate as the least deprived quintile in the local authority for each cause of death.")
18
Exercises Open Health Inequalities Intervention Tool web page http://www.lho.org.uk/HEALTH_INEQUALITIES/Health_I nequalities_Tool.aspx Look at the consequences of doubling the number of smoking quitters What are the age-groups and conditions which should cause you concern?

19
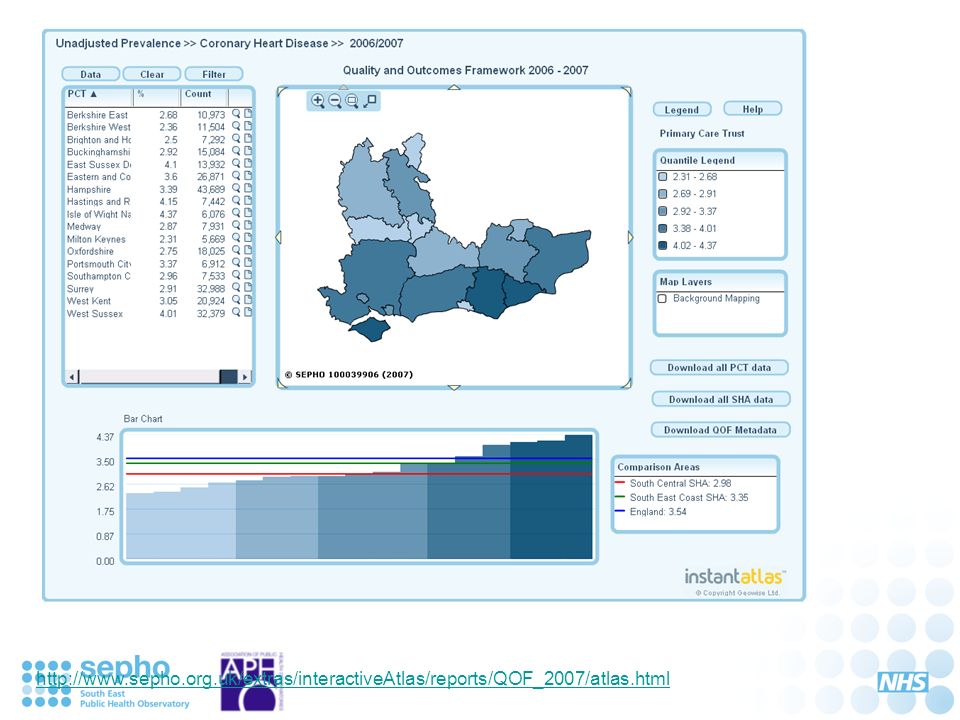
Prevalence models Models from research of expected prevalence of the diseases measured in the Quality Outcome Framework (QOF) Collection on APHO website http://www.apho.org.uk/resource/browse.aspx?RID=48308 Includes CHD, COPD, diabetes, hypertension, mental illness, stroke, and chronic kidney disease.
 Collection on APHO website RID=48308 Includes CHD, COPD, diabetes, hypertension, mental illness, stroke, and chronic kidney disease.")
20
Prevalence models Comparisons of national prevalence data from the Health Survey for England (HSE) and recorded prevalence from the Quality & Outcomes Framework (QOF) suggest that there is considerable under-diagnosis (in terms of IT system recording) of risk factors and diseases. This is probably due to under- recording of cases already known to practices, and lack of information in a proportion of cases, where patients may have been diagnosed previously by other practices or hospital consultants.Health Survey for EnglandQuality & Outcomes Framework

21
Others Diabetes commissioning tool http://www.dh.gov.uk/en/Publicationsandstatis tics/Publications/PublicationsPolicyAndGuid ance/DH_4140284 ASSET stroke commissioning tool http://www.dh.gov.uk/en/Publicationsandstatis tics/Publications/PublicationsPolicyAndGuid ance/DH_063260

22
National HES e-atlas Hospital episode admissions Direct standardised rates Diagnoses Procedures Link to Health Profiles http://www.apho.org.uk/default.aspx?QN=P_HES

24
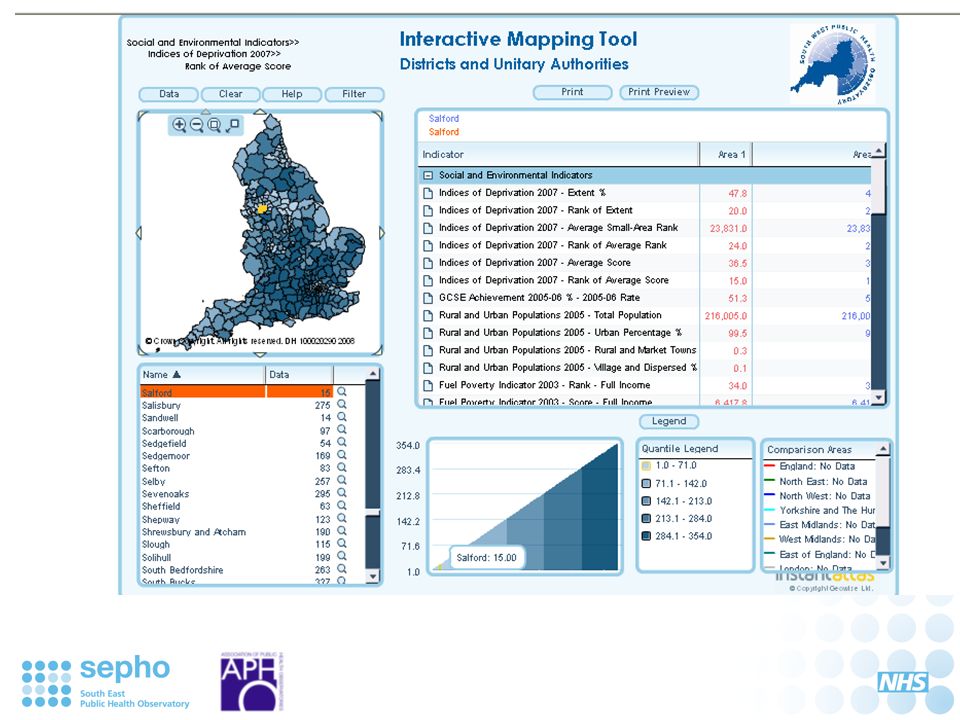
Joint Strategic Needs Assessment (JSNA) interactive mapping tool Many JSNA indicators for all Local Authorities in England http://www.swpho.nhs.uk/tools/35106/atlas.swf
 interactive mapping tool Many JSNA indicators for all Local Authorities in England")
26
Exercise Investigate some of these How would you use them in your organisation?

27
Floor targets interactive Interact with Maps and Data Area Profiles National Target Reports Regional and Sub-regional Change Index of Targets and Indicators Data Downloads http://www.fti.communities.gov.uk

28
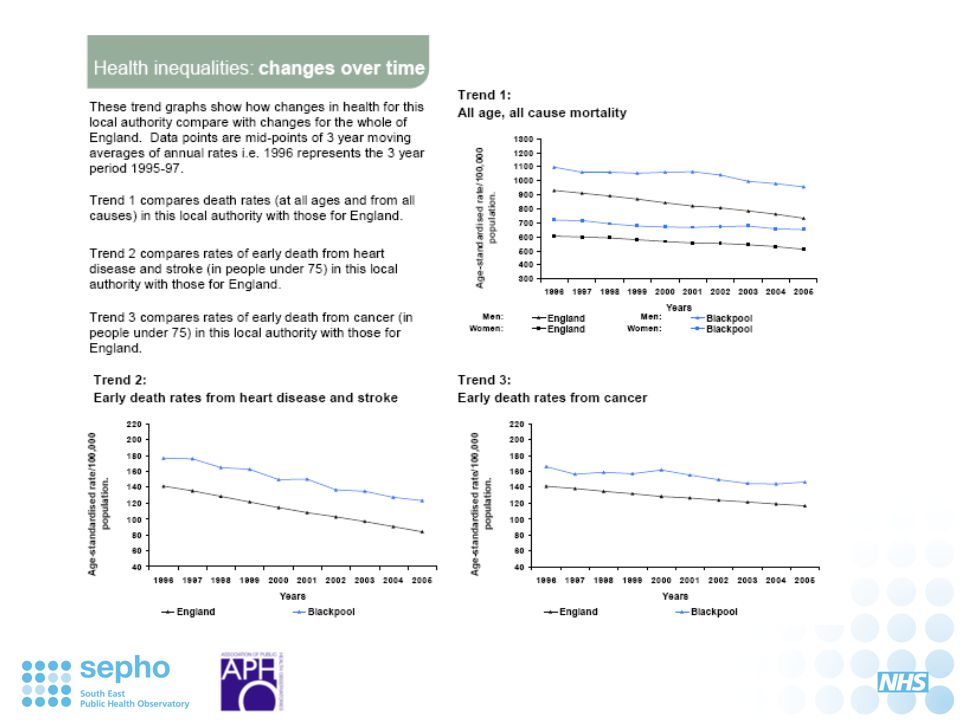
Trend data

29
Mapping facility

30
Top and bottom

31
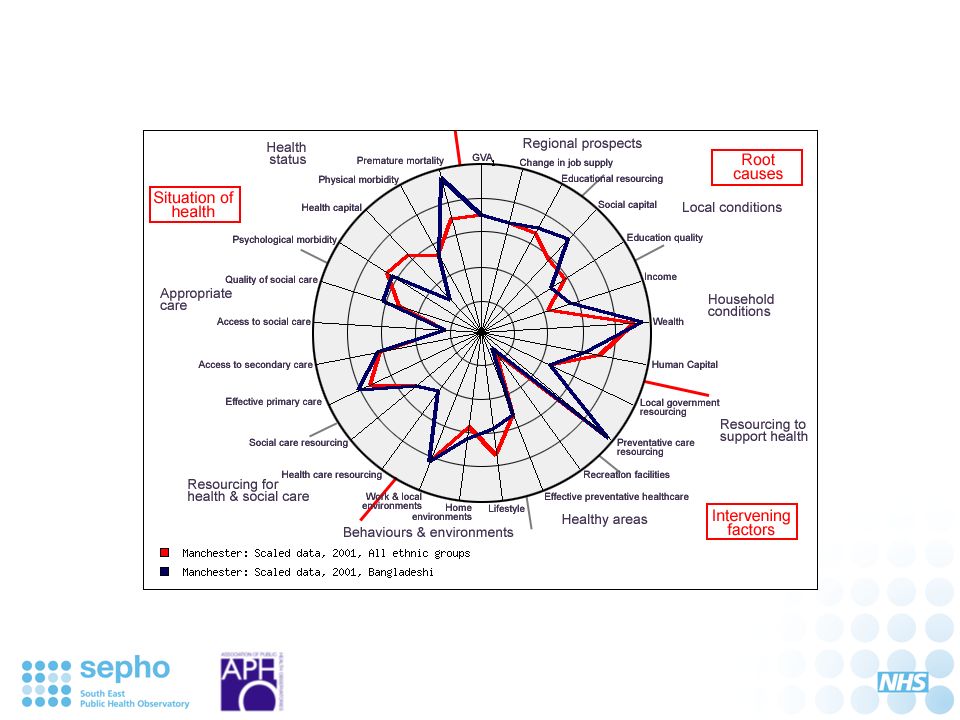
Health Poverty Index Commissioned by DH in 2000. Work done by University of St Andrews, the South East Public Health Observatory (SEPHO), the University of Oxford, and Oxford Consultants for Social Inclusion (OCSI) 2001 has data for different ethnic groups 2005 latest data Data are old, but things don’t change very fast Good on wider determinants www.hpi.org.uk
, the University of Oxford, and Oxford Consultants for Social Inclusion (OCSI) 2001 has data for different ethnic groups 2005 latest data Data are old, but things don’t change very fast Good on wider determinants")
35
HPI indicators

37
HPI strengths Compact data presentation Comparative data Innovative indicators Helpful for partnership working HPI weaknesses Timeliness Absolute data Some data definitions are not intuitive No interpretation of PH significance of some indicators

38
Exercise www.hpi.org.uk Go to HPI tool, select your areas, year, ethnic groups What are the obvious patterns? Change to ranked data. What does it tell you? Go to the Indicators page. Explore meanings of: –Health Capital, Human Capital, Psychological morbidity, Wealth –Thinking about “Wealth” is high good or bad, or in what circumstances? –Find some indicators which might help to inform discussions with your Local Authority Go to tabled data or Excel data Could you use these data for further exploration? NB Some of the data are “commercial in confidence” and were only supplied on the basis that they could not be disaggregated For further discussion see SWPHO reports

39
Examples of local information sources SEPHO – e.g. QOF CHD Look on Maps webpage http://www.sepho.org.uk/extras/interactiveAtlas/reports/atlasIndex.aspx SEE-IN Others?

40
http://www.sepho.org.uk/extras/interactiveAtlas/reports/QOF_2007/atlas.html
41
Life expectancy at birth at LAD 2005 SEE-IN Mainly economic data for South East, but does have some health indicators http://sdh.see-in.co.uk/

42
What you should have learnt Increased familiarity with some major tools to support decision making Their principles Their strengths and weaknesses How you might use them

Similar presentations


: Can it be used for more than just paying GPs?’ Ananda Allan Senior.>")


 www.yhtphn.co.uk/win.>")
 Helen Carter, NHS WM.>")


 UK Renal Registry 2011 Annual Audit Meeting.>")


