Download presentation
Presentation is loading. Please wait.

1
Sheng-Fang Huang Chapter 11 part I

2
After the image is segmented into regions, how to represent and describe these regions? ◦ In terms of its external characteristics (boundary) ◦ In terms of its internal characteristics (pixels in the region)
 ◦ In terms of its internal characteristics (pixels in the region).")
3
Chain codes are used to represent a boundary as a connected sequence of straight line segments of specified length and direction. ◦ Based on 4- or 8- connectivity. Chain code is generated by following a boundary in clockwise direction and assigning a direction to the segments connecting every pair of pixels. Disadvantages: 1)The chain code is quite long. 2)Any small disturbance along the boundary due to noise cause change in the code. →resample the boundary with a larger grid spacing.
The chain code is quite long. 2)Any small disturbance along the boundary due to noise cause change in the code. →resample the boundary with a larger grid spacing..")
6
The chain code of a boundary depends on the starting point and is not rotation invariant. ◦ We can normalize chain codes by using the first difference of the chain code. ◦ Example: The 4-direction chain code: 10103322 The first difference of the code: 33133030 3: (1-2) mod 4 = 3 3: (0-1) mod 4 = 3 1: (1-0) mod 4 = 1 ……
 mod 4 = 3 3: (0-1) mod 4 = 3 1: (1-0) mod 4 = 1 …….")
7
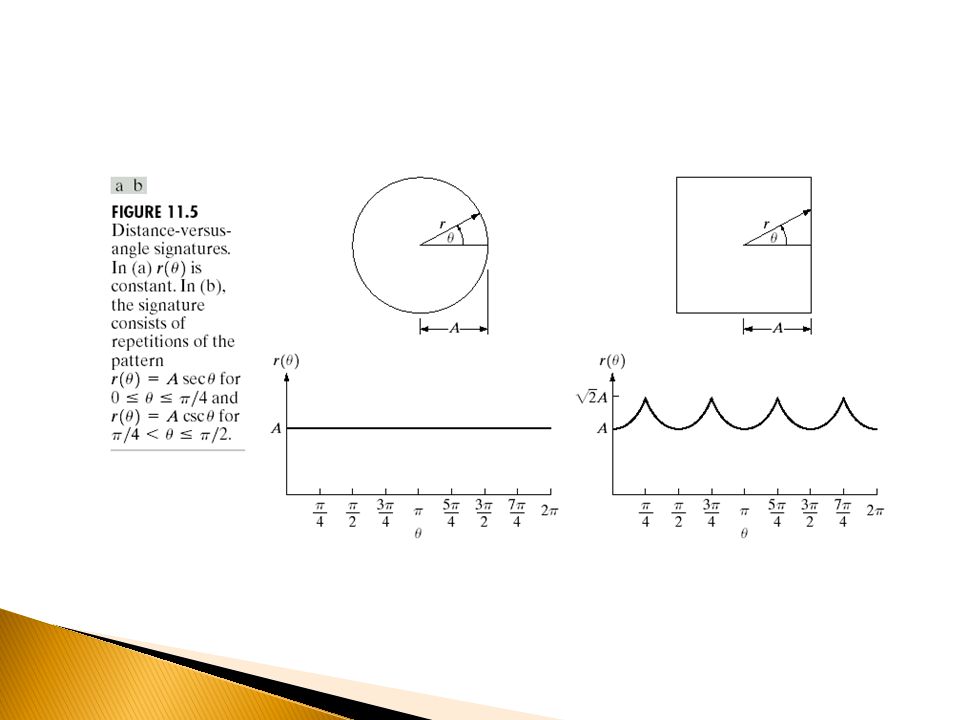
1-D functional representation of a boundary. Plot the distance from the centroid to the boundary as a function of angles, r( ). ◦ Invariant to translation, but depend on the rotation and scaling. Normalize with respect to rotation: Select the starting point as the point farthest to the centroid. Normalize with respect to size: Scale all r( ) so that they always span the same range, say, [0, 1]. Divided by the maximum. Divided by the variance of r( ).
. ◦ Invariant to translation, but depend on the rotation and scaling. Normalize with respect to rotation: Select the starting point as the point farthest to the centroid. Normalize with respect to size: Scale all r( ) so that they always span the same range, say, [0, 1]. Divided by the maximum. Divided by the variance of r( )..")
9
An important approach to representing the structural shape is to reduce it to a graph. ◦ This reduction may be achieved by obtaining its skeleton via a thinning algorithm (skeletonization). Medial axis transformation (MAT): ◦ proposed by Blum [1967] 1)For each point p in region R, we find its closest neighbor in the border B. 2)If p has more than one such neighbor, it is said to belong to the medial axis (skeleton) of R.
. Medial axis transformation (MAT): ◦ proposed by Blum [1967] 1)For each point p in region R, we find its closest neighbor in the border B. 2)If p has more than one such neighbor, it is said to belong to the medial axis (skeleton) of R..")
11
Thinning algorithm: iteratively delete the edge points of a region subject to the following constraints: 1)Does not remove the end points, 2)Does not break connectivity, and 3)Does not cause excessive erosion of the region.
Does not remove the end points, 2)Does not break connectivity, and 3)Does not cause excessive erosion of the region.")
13
What is the difference between representation and description? Simple descriptors 1)Length 2)Diameter: Diam(B)=max[D(p i, p j )] where p i and p j are two furthest points on the boundary. –The line between these two extremes are called the major axis. –The minor axis is the one perpendicular to the major axis where the major and minor axes form the basic rectangle. 3)Eccentricity = major axis/minor axis 4)Curvature: changes of slope. –Difficult in digit boundaries, because they are usually ragged. –Can be improved by using the curvature between adjacent boundary segments.
Length 2)Diameter: Diam(B)=max[D(p i, p j )] where p i and p j are two furthest points on the boundary. –The line between these two extremes are called the major axis. –The minor axis is the one perpendicular to the major axis where the major and minor axes form the basic rectangle. 3)Eccentricity = major axis/minor axis 4)Curvature: changes of slope. –Difficult in digit boundaries, because they are usually ragged. –Can be improved by using the curvature between adjacent boundary segments..")
14
The shape of boundary segments can be described by simple statistical moments, such as mean, variance, and higher-order moments. The nth moment of v about its mean m is

15
Figure 11.5 represented as 1-D function g(r). ◦ Treat the amplitude of g as a discrete random variable v and form an amplitude histogram p(v i ), i=0,1,…A-1, where A is the number of discrete amplitude increments in which we divide the amplitude scale.
, i=0,1,…A-1, where A is the number of discrete amplitude increments in which we divide the amplitude scale..")
16
The two endpoints are linked by a line segment. The coordinates of points are rotated until the line is horizontal. The distance of each point to the horizontal axis is normalized and treated as a discrete random variable to form an histogram p(v i ) where i=0,1,…A-1, g(r i ) is treated as the probability of which the value ri occurs.
 where i=0,1,…A-1, g(r i ) is treated as the probability of which the value ri occurs..")
17
The moments are where ◦ The second moment measures the spread of the curve about the mean value of r ◦ The third moment measures its symmetry with reference to the mean.

18
The area of a region is the number of pixels in the region. Perimeter is the length of the boundary. Compactness = perimeter 2 / area.

20
Topology is the study of properties of a figure that are unaffected by any deformation (rubber-sheet distortion). The number of holes: H The number of connected components: C Euler number E: E = C - H. Regions represented by straight-line segments (polygonal networks), such as fig. 11.20, has the following relationship in topology as E = V - Q + F = C- H where V is the number of vertices and Q is the number of edges.
, such as fig , has the following relationship in topology as E = V - Q + F = C- H where V is the number of vertices and Q is the number of edges..")
Similar presentations


 –division or separation of the image into segments (connected regions) of similar properties.>")


>")


