Download presentation
Presentation is loading. Please wait.

1
Review Chapter 1 Functions and Their Graphs

2
Lines in the Plane Section 1-1

3
The slope of the line passing through the two points (x 1, y 1 ) and (x 2, y 2 ) is given by the formula y 2 – y 1 x 2 – x 1 m =, (x 1 ≠ x 2 ). Definition of the Slope of a Line

4
The Slope of a Line 1.A line with positive slope (m>0) rises from left to right. 2.A line with negative slope (m<0) falls from left to right. 3.A line with zero slope (m=0) is horizontal. 4.A line with undefined slope is vertical.
 falls from left to right. 3.A line with zero slope (m=0) is horizontal. 4.A line with undefined slope is vertical..")
5
The point-slope form of the equation of the line that passes through the point (x 1, y 1 ) and has slope of m is y – y 1 = m(x – x 1 ). Point-Slope Form of the Equation of a Line

7
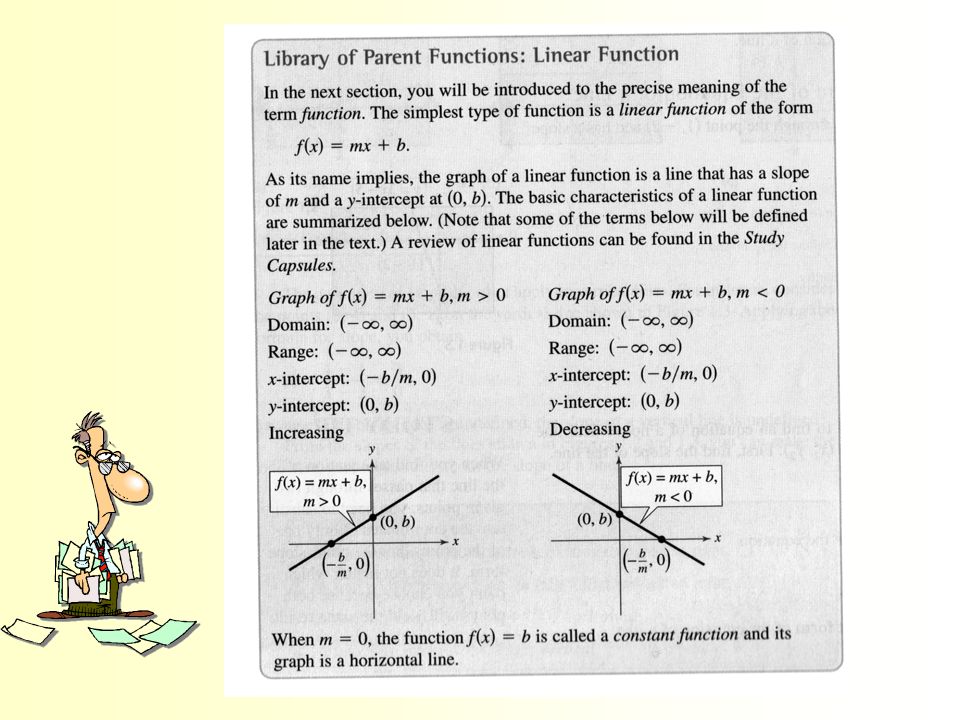
The graph of the equation y = mx + b is a line whose slope is m and the y-intercept is (0, b). Slope-Intercept Form of the Equation of a Line

8
Summary of Equations of Lines 1.General form: 2.Vertical line: 3.Horizontal line: 4.Slope-intercept form: 5.Point-slope form:

9
Two distinct nonvertical lines are parallel if and only if their slopes are equal. That is m 1 = m 2. Parallel Lines

10
Two nonvertical lines are perpendicular if and only if their slopes are negative reciprocals of each other. That is 1 m1m1 m 2 = - Perpendicular Lines

11
Functions Section 1-2

12
A function from a set A to a set B is a relation that assigns to each element x in the set A exactly one element y in the set B (for each x value there is one and only one y value). The set A (x values) is called the domain of the function. The set B (y values) is called the range of the function. Definition of Function
 is called the domain of the function. The set B (y values) is called the range of the function. Definition of Function.")
13
Four Ways to Represent a Function Verbally (description in words) Numerically (by a table of values) Visually (by a graph) Algebraically (by an equation or formula)
 Numerically (by a table of values) Visually (by a graph) Algebraically (by an equation or formula)")
14
Piecewise Function A piecewise function is an equation with multiple parts or pieces. It is made up of a series of different equations. Each different equation covers a different set of input values (or numbers on the x-axis) over the domain. A different piece of the domain is paired with each equation. The domain determines if the end points on the line are included or not. If the value is stated as equal to, then the value is represented with a closed circle on the line. If the value in the equation is stated as less than or greater than, but not equal too, then it is represented by an open circle.
 over the domain. A different piece of the domain is paired with each equation. The domain determines if the end points on the line are included or not. If the value is stated as equal to, then the value is represented with a closed circle on the line. If the value in the equation is stated as less than or greater than, but not equal too, then it is represented by an open circle..")
15
Absolute Value Function f(x) = │ x │ Characteristics: is a piecewise function. It decreases on the interval (- ∞, 0) and increases on the interval (0, ∞ ). It is continuous on its entire domain (- ∞, ∞ ). The vertex of the function is (0, 0).
 and increases on the interval (0, ∞ ). It is continuous on its entire domain (- ∞, ∞ ). The vertex of the function is (0, 0)..")
16
f(x) = x Square Root (Radical) Function Characteristics: f(x)= √ x increases and is continuous on its entire domain [0, ∞ ). Note: x ≥ 0 for f to be real.

17
Summary of Function Terminology Function: A function is a relationship between two variables such that to each value of the independent variable there corresponds exactly one value of the dependent variable. Function Notation: y = f(x) –f is the name of the function. –y is the dependent variable, or the output value. –x is the independent variable, or the input value. –f(x) is the value of the function at x, or the output value. Domain: The domain of a function is the set of all values (inputs) of the independent variable for which the function is defined. Range: The range of a function is the set of all values (outputs) assumed by the dependent variable. Implied Domain: If f is defined by an algebraic expression and the domain is not specified, the implied domain consists of all real numbers for which the expression is defined.
 –f is the name of the function. –y is the dependent variable, or the output value. –x is the independent variable, or the input value. –f(x) is the value of the function at x, or the output value. Domain: The domain of a function is the set of all values (inputs) of the independent variable for which the function is defined. Range: The range of a function is the set of all values (outputs) assumed by the dependent variable. Implied Domain: If f is defined by an algebraic expression and the domain is not specified, the implied domain consists of all real numbers for which the expression is defined..")
18
Graphs of Functions Section 1-3

19
Vertical Line Test A set of points in the xy-plane is the graph of a function if and only if every vertical line intersects the graph in at most one point.

20
Increasing and Decreasing Functions 1.Increasing function –The range values increase from left to right –The graph rises from left to right –Positive slope 2.Decreasing function –The range values decrease from left to right –The graph falls from left to right –Negative slope Suppose that a function f is defined over an interval I. a.f increases on I if, whenever b.f decreases on I if, whenever c.f is constant on I if, for every

21
Relative Minimum and Maximum Values of a Function A function f has a relative (local) maximum at x = c if there exists an open interval (r, s) containing c such that for all x between r and s. A function f has a relative (local) minimum at x = c if there exists an open interval (r, s) containing c such that for all x between r and s. Relative Maximums Relative Minimums
 minimum at x = c if there exists an open interval (r, s) containing c such that for all x between r and s. Relative Maximums Relative Minimums.")
22
Greatest Integer Function – Step Function The greatest integer function, denoted by ⟦ x ⟧ and defined as the largest integer less than or equal to x, has an infinite number of breaks or steps – one at each integer value in its domain. Also called the rounding-down or the floor function. Basic characteristics; –Domain: (-∞, +∞) –Range: {y: y = n, n є Z } –x-intercepts: in the interval [0, 1) –y-intercept: (0, 0) –Is a piecewise function. –Constant between each pair of consecutive integers. –Jumps vertically one unit at each integer value.
 –Range: {y: y = n, n є Z } –x-intercepts: in the interval [0, 1) –y-intercept: (0, 0) –Is a piecewise function. –Constant between each pair of consecutive integers. –Jumps vertically one unit at each integer value..")
23
Even and Odd Functions A function f is called an even function if for all x in the domain of f. (Its graph is symmetric with respect to the y-axis.) A function f is called an odd function if for all x in the domain of f. (Its graph is symmetric with respect to the origin.)
 A function f is called an odd function if for all x in the domain of f. (Its graph is symmetric with respect to the origin.).")
24
Shifting, Reflecting, and Stretching Graphs Section 1-4

25
Vertical Translations of Graphs Vertical Shifting of the Graph of a Function If the graph of is obtained by shifting the graph of upward a distance of c units. The graph of is obtained by shifting the graph of downward a distance of c units.

26
Horizontal Translations of Graphs Horizontal Shifting of the Graph of a Function If the graph of is obtained by shifting the graph of right a distance of c units. The graph of is obtained by shifting the graph of left a distance of c units. Figure 22 pg 2-31

27
Vertical Stretching Vertical Stretching of the Graph of a Function If c > 1, the graph of is obtained by vertically stretching the graph of by a factor of c. In general, the larger the value of c, the greater the stretch.

28
Vertical Shrinking Vertical Shrinking of the Graph of a Function If the graph of is obtained by vertically shrinking the graph of by a factor of c. In general, the smaller the value of c, the greater the shrink.

30
Reflecting Across an Axis Reflecting the Graph of a Function Across an Axis For a function (a) the graph of is a reflection of the graph of f across the x-axis. (b) the graph of is a reflection of the graph of f across the y-axis.
 the graph of is a reflection of the graph of f across the y-axis..")
31
A function involving more than one transformation can be graphed by performing transformations in the following order: 1.Horizontal shifting 2.Stretching or shrinking 3.Reflecting 4.Vertical shifting

32
Combinations of Functions Section 1-5

33
Sums, Differences, Products, and Quotients of Functions If f and g are functions and x is in the domain of each function, then Domain for sums, differences, products and quotients of functions is the intersection of the domains of functions f and g (D f ∩D g ).
.")
34
Definition of Composition of Two Functions Given two functions f and g, the composite function is defined by and is read “f of g of x.” The domain of is the set of elements x in the domain of g such that g(x) is in the domain of f. – Another way to say that is to say that “the range of function g must be in the domain of function f.” x f(g(x)) domain of g range of f range of g domain of f g f
) domain of g range of f range of g domain of f g f.")
35
Inverse Functions Section 1.6

37
A function y = f (x) with domain D is one-to-one on D if and only if for every x 1 and x 2 in D, f (x 1 ) = f (x 2 ) implies that x 1 = x 2. A function is a mapping from its domain to its range so that each element, x, of the domain is mapped to one, and only one, element, f (x), of the range. A function is one-to-one if each element f (x) of the range is mapped from one, and only one, element, x, of the domain. One-to-One Functions
, of the range. A function is one-to-one if each element f (x) of the range is mapped from one, and only one, element, x, of the domain. One-to-One Functions.")
38
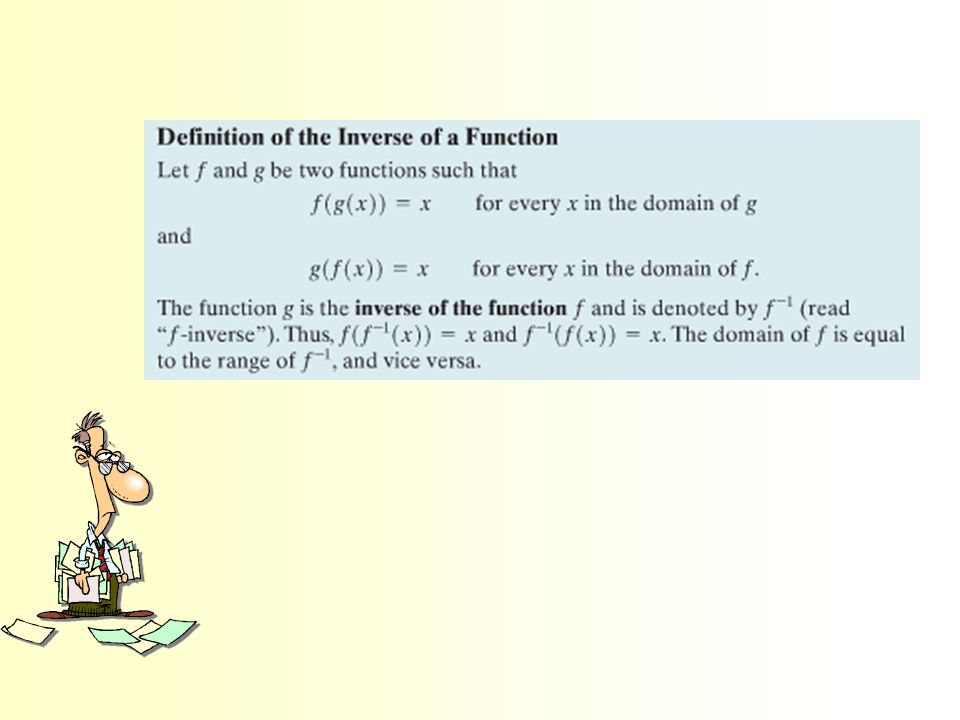
A function, f, has an inverse function, g, if and only if the function f is a one-to-one function. Existence of an Inverse Function

40
Assignment Chapter 1 Test, pg. 88: #1-19 all

Similar presentations

 = |x|, the absolute value function. The domain is the set of all real numbers. The graph is symmetric with respect to the.>")


. Symbols for Number Set Counting numbers ( maybe 0, 1, 2, 3, 4, and so on) Natural Numbers: Positive and negative.>")


