Download presentation
Presentation is loading. Please wait.

1
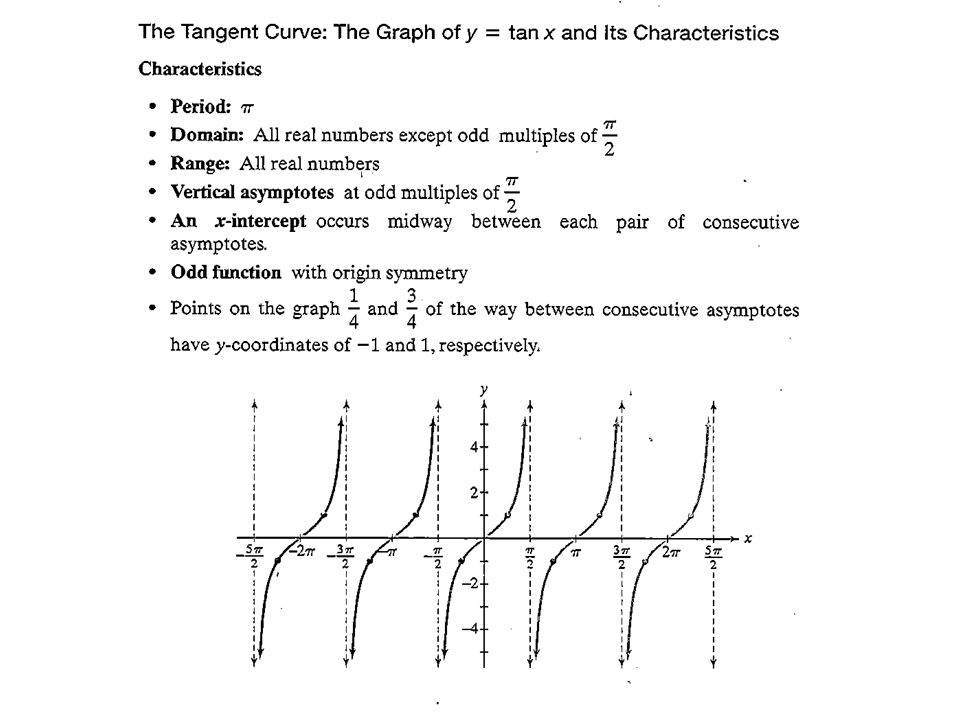
Graphing y = tan x x = 0, tan (0) = _____ (, ) x = π/4, tan (π/4) = _____ (, ) x = π/2, tan (π/2) = _____ (, ) x = -π/4, tan (-π/4) = _____ (, ) x = -π/2, tan (-π/2) = _____ (, )
 = _____ (, ) x = π/4, tan (π/4) = _____ (, ) x = π/2, tan (π/2) = _____ (, ) x = -π/4, tan (-π/4) = _____ (, ) x = -π/2, tan (-π/2) = _____ (, )")
2
Graphing y = cot x x = 0, cot (0) = _____ (, ) x = π/4, cot (π/4) = _____ (, ) x = π/2, cot (π/2) = _____ (, ) x = 3π/4, cot (3π/4) = _____ (, ) x = π, cot (π) = _____ (, ) x = 0, cot (0) = _____ (, ) x = π/4, cot (π/4) = _____ (, ) x = π/2, cot (π/2) = _____ (, ) x = -π/4, cot (-π/4) = _____ (, ) x = -π/2, cot (-π/2) = _____ (, )
 = _____ (, ) x = π/4, cot (π/4) = _____ (, ) x = π/2, cot (π/2) = _____ (, ) x = 3π/4, cot (3π/4) = _____ (, ) x = π, cot (π) = _____ (, ) x = 0, cot (0) = _____ (, ) x = π/4, cot (π/4) = _____ (, ) x = π/2, cot (π/2) = _____ (, ) x = -π/4, cot (-π/4) = _____ (, ) x = -π/2, cot (-π/2) = _____ (, )")
4
Graphing Tan 1.Find a pair of consecutive asymptotes 2.Find T 3.Find 3 key points

5
Graph y = 3 tan x What changes?

6
Graph y = tan x + 3 What changes?

7
Graph y = tan (2x – π/4) -(π/2) < Bx - C < (π/2)
 -(π/2) < Bx - C < (π/2)")
8
Graphing y = cot x

9
Graphing Cot 1.Find a pair of consecutive asymptotes 2.Find T 3.Find 3 key points

10
Graph y = 2 cot x –2

11
Graph y = cot(4x – π/2) 0 < Bx - C < π
 0 < Bx - C < π")
12
Graphing Trigonometric Functions Standard form: y = A tan (Bx - C) + D or y = A cot (Bx - C) + D Amplitude = “none” (but it does change “slope” of curve (check when “tan x = 1”)) Period = π / |B| Asymptotes: (tan x): x=(C ± (π/2)) / B Asymptotes (cot x): x= C / B, (C + π) / B Vertical shift = D Domain (tan x): -∞ ≤ x ≤ +∞, x ≠ n(π/2), n odd integer Domain (cot x): -∞ ≤ x ≤ +∞, x ≠ n(π) Range: -∞ ≤ y ≤ +∞ Three key points: (, ), (, ), (, ) Drawing the curve: (1) Determine D, the vertical phase shift. This will be the “new” horizontal axis at y = D. (2) Determine and draw the asymptotes (this identifies period and phase shift). (3) Divide the period into four equivalent parts - label each interval. (4) Evaluate the function for each of the three x values resulting from Step 3. (5) Plot those points found in Step 4 and join them with a curve. (6) Draw for two cycles
 Determine and draw the asymptotes (this identifies period and phase shift). (3) Divide the period into four equivalent parts - label each interval. (4) Evaluate the function for each of the three x values resulting from Step 3. (5) Plot those points found in Step 4 and join them with a curve. (6) Draw for two cycles.")
Similar presentations


 – 1.>")


 = f(x) for every x in the domain of f, every integer n, and some positive number p.>")

 0 /6 /4 /3 /2 2 /3 3 /4 5 /6 7 /6 5 /4 4 /3 3 /2 5 /3 7 >")


