Download presentation
Presentation is loading. Please wait.

1
Guoliang Li Shanghai Astronomic Observatory November 1st, 2006 November 1st, 2006 The giant arc statistic in the three-year WMAP cosmological model COLLABORATORS: Shude mao (JBO) Yipeng Jing, Xi Kang, Weipeng Lin (SHAO) Matthias Bartelmann, Massimo Menegentti (Heidelberg) Liang Gao (Durham)
 Yipeng Jing, Xi Kang, Weipeng Lin (SHAO) Matthias Bartelmann, Massimo Menegentti (Heidelberg) Liang Gao (Durham)")
2
Giant arcs are background galaxies distorted into long arcs by foreground clusters A2218 Z=0.175

3
Z=0.18 A1689 Observations can determine, arc L/W ratio, width, source redshift & arc frequency

4
Why do we study giant arcs? Giant arcs probe the largest bound structures in the universe Their numbers and positions are a sensitive probe of cluster properties including their abundance and mass profiles Their numbers are also sensitive to the cosmogony, particularly the power-spectrum normalisation σ 8 Clusters are nature telescope, allow us to study high-z background objects

5
Observational samples of giant arcs Luppino et al. found strong lensing in eight out of 38 X-ray selected clusters (Bartelmann(1998) predicted the frequency is 7x10 -3 deg -2 but the observation is 3.7~5.6x10 -2 deg -2 ) Zaritsky & Gozalez (2003) using LCRS and Gladders et al. (2003) using RCS also found high fractions Sand, Ellis, Treu, & Smith (2005) found 104 candidate tangential arcs in 128 clusters with HST Giant arcs appear common in massive clusters and the discrepancy with Bartelmann is kept.
 predicted the frequency is 7x10 -3 deg -2 but the observation is 3.7~5.6x10 -2 deg -2 ) Zaritsky & Gozalez (2003) using LCRS and Gladders et al. (2003) using RCS also found high fractions Sand, Ellis, Treu, & Smith (2005) found 104 candidate tangential arcs in 128 clusters with HST Giant arcs appear common in massive clusters and the discrepancy with Bartelmann is kept..")
6
How do we model giant arcs? Earlier studies used analytical spherical models (e.g. Wu & Hammer 1993; Wu & Mao 1996). But clusters are complex (ellipticities, substructures, mergers). More realistic studies use numerical simulated clusters –Bartelmann and associates (1998-) –Dalal et al. (2004) –Li, Mao, Jing, Bartelmann, Kang, Meneghetti (2005) –Wambsganss, Ostriker, Bode (2004): 3D ray-tracing
. But clusters are complex (ellipticities, substructures, mergers). More realistic studies use numerical simulated clusters –Bartelmann and associates (1998-) –Dalal et al. (2004) –Li, Mao, Jing, Bartelmann, Kang, Meneghetti (2005) –Wambsganss, Ostriker, Bode (2004): 3D ray-tracing.")
7
High resolution simulations Numerical simulations performed by Jing (2000) –Dark matter only, 512 3 particles –Box size: 300/h Mpc, 30/h kpc (comoving) resolution 200 massive clusters are selected using the friends- of-friends algorithm, from redshift 0.1, 0.2, …, 2.5 Background source population –At redshift 0.6, 1.0, 1.4, …., 7 –Sources have 0.5, 1, 1.5 arcsecond effective diameter –Ellipticity: 1-b/a, from 0.5 to 1 Integrate the cross-sections of all clusters to get the total lensing cross sections.
 –Dark matter only, particles –Box size: 300/h Mpc, 30/h kpc (comoving) resolution 200 massive clusters are selected using the friends- of-friends algorithm, from redshift 0.1, 0.2, …, 2.5 Background source population –At redshift 0.6, 1.0, 1.4, …., 7 –Sources have 0.5, 1, 1.5 arcsecond effective diameter –Ellipticity: 1-b/a, from 0.5 to 1 Integrate the cross-sections of all clusters to get the total lensing cross sections.")
9
Optical depth as a function of source redshift Optical depth ~ 10 -7 for z s =1, but 10 -6 for z s =4 –Several previous values are too high due to incorrect assumptions of sigma_8 and L/W definition –Consistent with Dalal et al. (2004) Strong zs dependence Weaker dependence on ellipticity and source size
 Strong zs dependence Weaker dependence on ellipticity and source size.")
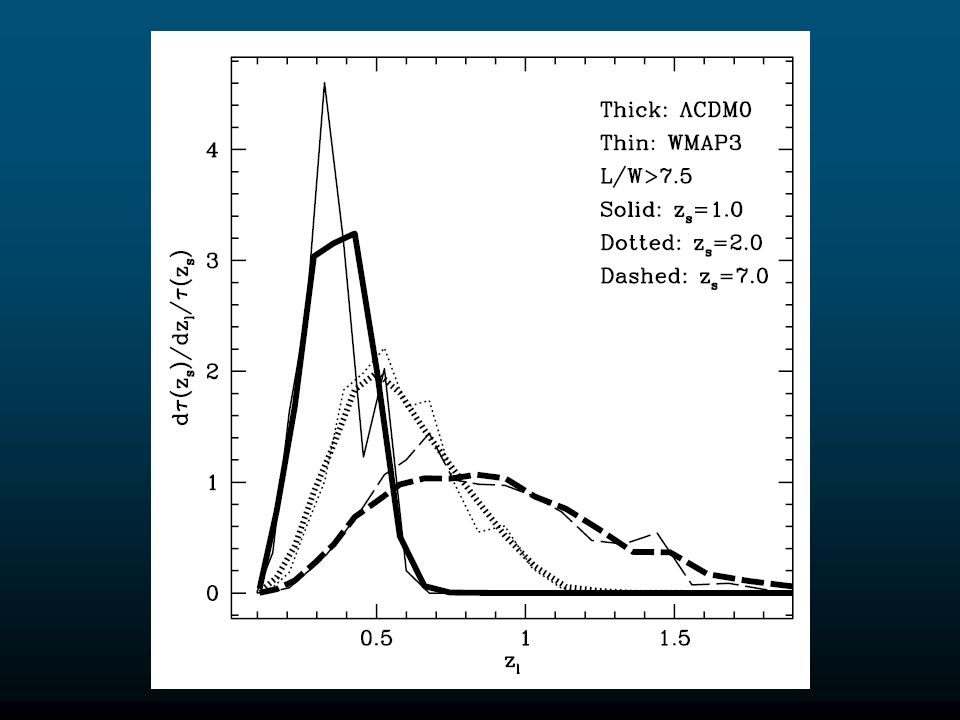
10
Optical depth as a function of lens redshift For sources at high z, probe clusters at high redshift Gladders et al. who found all of their lensing clusters were at z>0.62; understood if source z is high.

11
Comparing with Bartelmann (1998), Dalal et al. (2004) pointed that the numbers of lens and should be increased by a factor of 2. The giant arcs number which they predicted is in good agreement with almost all of the observations. What will happen in the three-year WMAP universe?
 pointed that the numbers of lens and should be increased by a factor of 2. The giant arcs number which they predicted is in good agreement with almost all of the observations. What will happen in the three-year WMAP universe .")
12
Giant arcs in the WMAP3 cosmology The WMAP three-year model has lower m and 8 compared with the WMAP one-year model. The lower m (0.238) and 8 (0.74) both reduce the number of giants We compared the arc predictions in the usual LCDM and WMAP three-year model: –Using two 300/h Mpc N-body simulations –The predicted number is reduced by a factor of about six in the WMAP three year model –Easily understood due to the abundance of clusters
 and 8 (0.74) both reduce the number of giants We compared the arc predictions in the usual LCDM and WMAP three-year model: –Using two 300/h Mpc N-body simulations –The predicted number is reduced by a factor of about six in the WMAP three year model –Easily understood due to the abundance of clusters.")
13
Predicted number of giant arcs Effect of star formation? Likely a factor of 2 Source redshift distribution, size, ellipticity(modest)
.")
15
The way to increase the lensing efficiency The asysmetric of lens----------------ok The merger effect------------------- --ok The substructure-----------------------ok The redshift distribution of source ---ok The size and shape of source ---modest The mass around the line of sight----<7% The baryon effect ---not very clear(~2)
")
16
Summary Optical depth may be too low in the WMAP three-year model (with 8 =0.74) We need many larger giant arc unbiased samples -- they will come as by-products of weak lensing surveys.
 We need many larger giant arc unbiased samples -- they will come as by-products of weak lensing surveys.")
17
Thanks !

Similar presentations


 Access to mock catalogues through VO Provide analysis.>")

>")


 Chris Power, Brad Gibson (Swinburne), Peder Norberg (ETH), Dennis Zaritsky.>")


, J. Rhodes ( Jet Propulsion Laboratory) & the.>")

 Collaborators: Richard Ellis (Caltech) David Bacon (Cambridge) Richard.>")

