Download presentation
Presentation is loading. Please wait.

1
IAPT Providers and System Suppliers Stakeholder User Group Friday 20 th May 2016, Trevelyan Square, Leeds presented by HSCIC

2
Introductions & Updates Presented by Stephanie Gebert, Analytical Section Head, HSCIC

3
Overview Introductions Housekeeping –Fire Alarm –Toilets Ask questions Feedback to us –Today (inc. forms) –enquiries@hscic.gov.ukenquiries@hscic.gov.uk Slides published after event
 Slides published after event.")
4
Welcome and Introductions HSCIC Paul EllinghamData Manager Paul JenningsSenior Information Analyst Steph GebertAnalytical Section Head Guest speakers Prof. David ClarkOxford Centre for Anxiety Disorders and Trauma Michael WatsonNHS Improvement

5
Future Developments Presented by Stephanie Gebert, Analytical Section Head, HSCIC

6
Spending review implies substantial increase in IAPT access – new targets? Already meeting headline waiting targets Provide greater: perinatal access and support, proof of concept using data linkage IAPT maintenance release Merge IAPT data set with MHSDS (April 2018) IAPT Developments 6
 IAPT Developments 6.")
7
Annual report – planned content Analysis of people with long term conditions People in the British Armed Forces WSAS – improvements in the data quality sufficient to allow analysis of the data Waiting times – additional summaries IAPT Developments 7

8
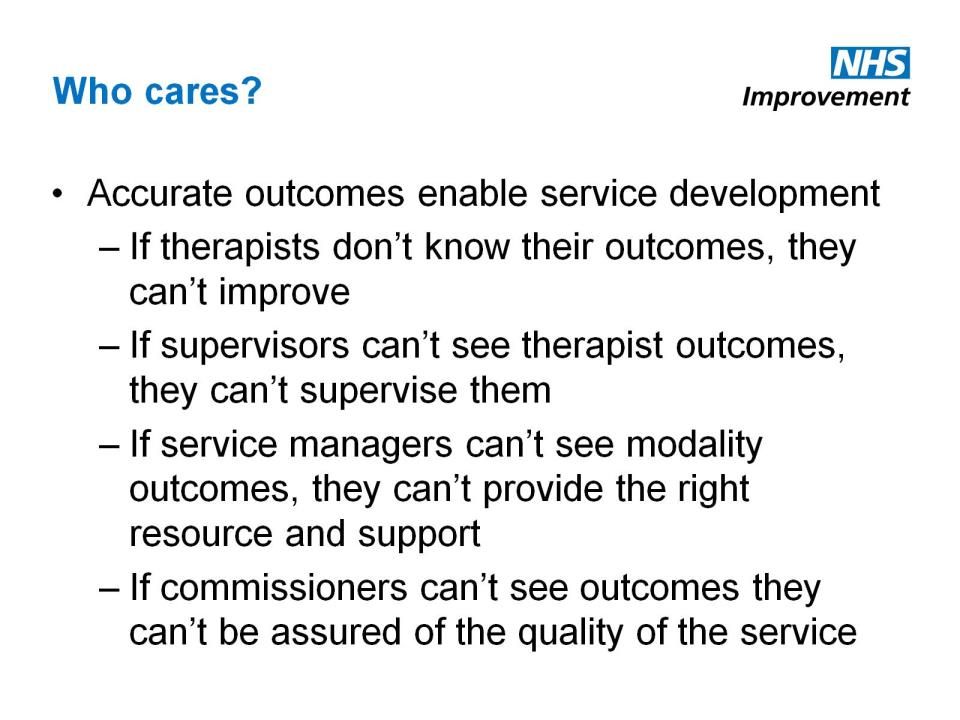
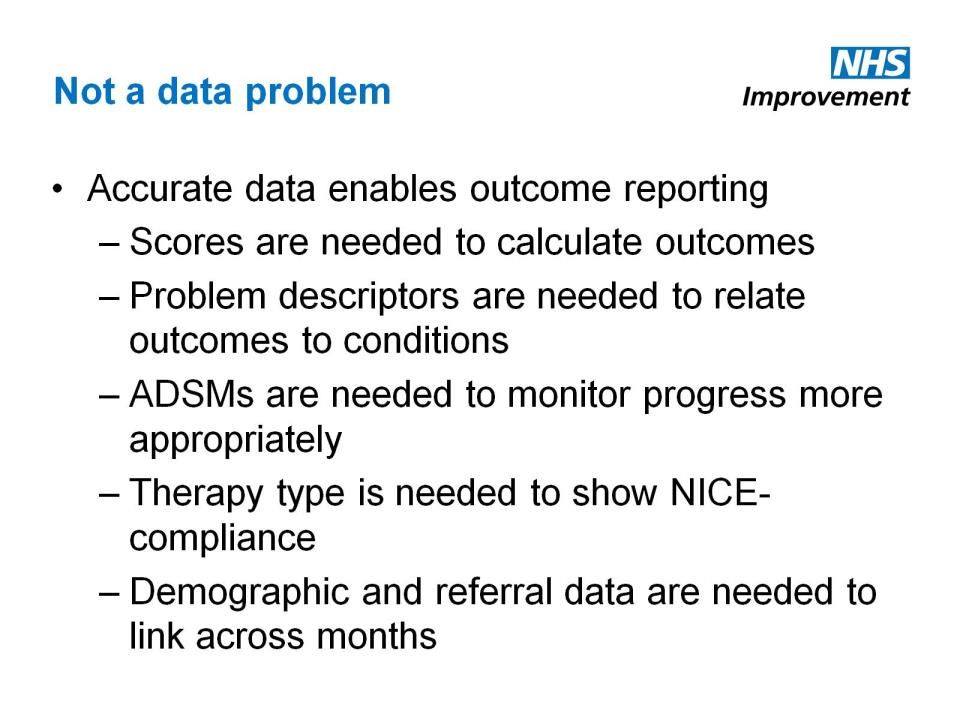
How Data Links to Quality Outcomes Presented by Michael Watson – NHS England

23
Reporting Update and Consultations Presented by Paul Jennings – Senior Information Analyst, HSCIC

24
Purpose of this session Where we’ve come from Overview of the evolving IAPT publications Where we are now Future developments We want your feedback!

25
Where we’ve come from IAPT data collection started in April 2012 and data were published quarterly until Q3 2014/15 25 Executive Summary Summary Statistics and related information

26
Where we’ve come from Measures of activity 26 Measures of waiting times Measures of outcome New referrals by age/ gender/ ethnicity/ disability/ problem descriptor New referrals fro service users waiting more than 28 days for treatment Referrals ending by end code PHQ9 and anxiety measure data completeness for referrals finishing a course of treatment Psychotropic medication status for referrals finishing a course of treatment Number of referrals ending where the service user has moved off sick pay Duration of treatment for referrals ending Length of time of no activity for open referrals Number of days from referral received to first assessment Number of days from referral received to first treatment Number of referrals finishing a course of treatment by age/ gender/ ethnicity/ disability/ problem descriptor Number of referrals moving to recovery Number of referrals finishing a course of treatment where the service user was not initially at caseness Number of referrals with reliable improvement/ reliable deterioration/ no reliable change Number of referrals with reliable recovery

27
Where we are now Since January 2015 data (published in April 2015), we have moved to monthly reporting. 27 Executive Summary Monthly Activity Data File CSV Quarterly supplementary information

28
Where we are now Measures of activity 28 Previous quarterly publications Current monthly publications New referrals by age/ gender/ ethnicity/ disability/ problem descriptor New referrals fro service users waiting more than 28 days for treatment Referrals ending by end code PHQ9 and anxiety measure data completeness for referrals finishing a course of treatment Psychotropic medication status for referrals finishing a course of treatment Number of referrals ending where the service user has moved off sick pay Duration of treatment for referrals ending Length of time of no activity for open referrals Number of referrals received, number of self-referrals Assessments Number of referrals having a first assessment in the month Number of referrals ending without an assessment Number of referrals waiting for first assessment at month end Referrals entering treatment Number of referrals entering treatment in the month Number of referrals ending before treatment Number of referrals waiting for treatment at month end Appointments Number of appointments in the month Number of appointments cancelled by the patient Number of appointments cancelled by the provider Number where patient did not attend Number of attended appointments, attended late, not seen Number of appointments with recorded PHQ9 and anxiety scores Number/ min/ max/ mean/ median appointments for referrals finishing a course of treatment Number of appointments split by therapy type Mean appointments per last therapy type Referrals ending Number of referrals ending Number of ended referrals split by end reason Number of referrals ending having not been treated Number of referrals ending having been treated once Number of referrals finishing a course of treatment Number of referrals ending without being seen

29
Where we are now Measures of waiting times 29 Previous quarterly publications Current monthly publications Number of days from referral received to first assessment Number of days from referral received to first treatment Waiting times between referral and first assessment Waiting times between referral and first treatment Waiting times between first and second treatment appointment Average waiting times to enter treatment Waiting times for open referrals

30
Where we are now Measures of outcomes 30 Previous quarterly publications Current monthly publications Number of referrals finishing a course of treatment by age/ gender/ ethnicity/ disability/ problem descriptor Number of referrals moving to recovery Number of referrals finishing a course of treatment where the service user was not initially at caseness Number of referrals with reliable improvement/ reliable deterioration/ no reliable change Number of referrals with reliable recovery Number of referrals finishing a course of treatment Number of referrals moving to recovery Number of referrals finishing a course of treatment where the service user was not initially at caseness Number of referrals with reliable improvement/ reliable deterioration/ no reliable change Number of referrals with reliable recovery

31
Where we are now Comprehensive Data Quality Reports with every publication 31

32
Reference documents 32 Reporting FAQsMetadataDQ StatementPAVE Specification http://www.hscic.gov.uk/iaptmonthly …and more!

33
The Metadata file Recent internal review of publications identified that users can have difficulty finding particular measures in reports. 33 Metadata file was first made available in April 2015 to help users interpret new-style reports. http://www.hscic.gov.uk/iaptmonthly (find it in the “Related Documents” section)
.")
34
Using the Metadata file “I want to understand how to calculate the ‘moved to recovery’ rate.” 34

35
Using the Metadata file 35 “I want to understand how to calculate the ‘moved to recovery’ rate.” “Referrals with an end date in the month that finished a course of treatment where the service user has moved to recovery” Count of distinct (IC_PATHWAY_ID) where ENDDATE is within the period and IC_v1_5_COMPLETED_TREATMENT_FLAG = "y" and IC_LAST_PHQ9 is not null and IC_LAST_ADSM_SCORE is not null and (IC_FIRST_PHQ9 at caseness) or (IC_FIRST_ADSM_SCORE at caseness) and IC_LAST_PHQ9 and IC_LAST_ADSM_SCORE not at caseness*
 where ENDDATE is within the period and IC_v1_5_COMPLETED_TREATMENT_FLAG = y and IC_LAST_PHQ9 is not null and IC_LAST_ADSM_SCORE is not null and (IC_FIRST_PHQ9 at caseness) or (IC_FIRST_ADSM_SCORE at caseness) and IC_LAST_PHQ9 and IC_LAST_ADSM_SCORE not at caseness*")
36
Using the Metadata file 36 Recovery (FinishedCourseTreatment - NotCaseness) 18,652 (42,298 – 3,398) X 100= 47.9% moved to recovery
 18,652 (42,298 – 3,398) X 100= 47.9% moved to recovery")
37
What else can the Metadata be used for? Recreating HSCIC figures using local extracts 37 Identifying data quality As a reference for calculating outcome measures

38
Identifying DQ issues using the Metadata 38

39
Recreating HSCIC figures using Metadata 39

40
Glossary 40

41
Reviews and feedback Difficult to find key fields (e.g. recovery) HSCIC should publish rates based on unrounded numbers Large number of questions about constructions and criteria for measures Difficulty in finding publications or supporting documents 41
 HSCIC should publish rates based on unrounded numbers Large number of questions about constructions and criteria for measures Difficulty in finding publications or supporting documents 41.")
42
Using the HSCIC webpages 42 http://www.hscic.gov.uk All HSCIC publications, publications calendar http://www.hscic.gov.uk/iapt Information about the dataset, Technical Specifications http://www.hscic.gov.uk/iaptreports List of all historic IAPT publications http://www.hscic.gov.uk/iaptmonthly Supporting documents and link to most recent publication

43
Feedback – Expert User Group meeting Monthly publications 43 Casemix adjustment Recovery by severity of condition Time series Publish rates for key measures Executive Summary not regularly used Waiting times reported quarterly also Reporting of WSAS Reporting by Long Term Condition

44
Feedback – Expert User Group meeting HSCIC’s IAPT webpages 44 Organise publication resources into a grid and explain each document’s purpose Links to relevant external sites should be provided Webpages are too wordy Too many links on IAPT Reports page

45
Feedback – Expert User Group meeting Guidance documents 45 More ‘Plain English’ description of the dataset List of planned IAPT publication dates More clearly defined information about key concepts such as recovery Guidance is too technical Guidance is too difficult to find

46
Feedback – Expert User Group meeting If you’d like to register your interest in attending future Expert User Groups, let us know on your feedback form or email enquiries@hscic.gov.ukenquiries@hscic.gov.uk (put “IAPT” in the email header) 46
 46")
47
What are we going to do? User consultation survey on our webpages: http://www.hscic.gov.uk/iaptmonthly http://www.hscic.gov.uk/iaptreports 47 Investigate changes which can be easily implemented or for which we have evidence that a change meets users’ needs Next annual publication released in October and will contain new analyses

48
48

49
Lunch 12.30 – 13.15

50
IAPT Data Quality Update Presented by Paul Ellingham – Data Manager, HSCIC Community and Mental Health Team, HSCIC

51
WASAS DQ In September’s data we saw a large increase (12%) in all five WASAS DQ measures. October saw a further 9% increase. 51

52
WSAS DQ Traced increase to a system change at IAPTus –Change to require users to entire five scores instead of total WSAS January final data shows that now at 82%+ validity for these five scores We will now be reporting using WSAS in our next Annual Report 52

53
ADSM DQ – EUG feedback Concerns around the current level of ADSM DQ –National mean of 13% Discussed at the Expert User Group –Clinical practice –Possible alternative DQ measures A lack of current guidance on the use of ADSMs was identified Any changes to the DQ measure will be postponed until guidance is released 53

54
New Guidance on Changing Codes/Systems Covers scenarios like: –Change of ODS code –Change of System Supplier –Merging of Services Available from: http://www.hscic.gov.uk/media/20418/IAPT- Guidance-on-Changes-in-Provider-or-System- Supplier/pdf/IAPT_Guidance_on_Changes_in_P rovider_or_System_Supplier.pdf http://www.hscic.gov.uk/media/20418/IAPT- Guidance-on-Changes-in-Provider-or-System- Supplier/pdf/IAPT_Guidance_on_Changes_in_P rovider_or_System_Supplier.pdf 54

55
Missing Appointment Tables Still seeing small number of providers submitting appointments for incorrect period Can occur if Primary file uploaded as Refresh, for example Has a big impact Working individually with affected providers Ensure that pre-deadline extracts and diagnostics checked after upload Will be closing the loophole in the next maintenance release 55

56
PAVE Extract available from Data Depot Record-level showing contribution of that record to key monthly measures Some planned changes: –Include ability to look at referrals NOT at caseness –Indicate where the person attached to a referral is a Bypass Patient –Improve the documentation 56

57
Any questions? 57

58
Using Data for Service Improvement Presented by Professor David Clark - National Clinical and Informatics Advisor for IAPT

59
Using IAPT Data for Service Improvement David M Clark National Clinical and Informatics Advisor for Adult IAPT University of Oxford (david.clark@psy.ox.ac.uk)

60
IAPT So Far Transformed treatment of anxiety & depression Stepped care psychological therapy services established in every area of England. Self-referral. Approx 15% of local prevalence seen in services Around 60% have course of treatment (approx 530,000 per year) Outcomes recorded in 97% of cases (pre-IAPT 38%) Very strict (depression & anxiety) recovery criteria Nationally 48% recover and further 16% improve. Over 40% CCGs have recovery > 50%, some > 60%. Variability must be the next focus.
 Outcomes recorded in 97% of cases (pre-IAPT 38%) Very strict (depression & anxiety) recovery criteria Nationally 48% recover and further 16% improve. Over 40% CCGs have recovery > 50%, some > 60%. Variability must be the next focus..")
61
What is our current variability? Recovery rate: 45% (range 19%** to 69%) (47.9% Jan16) Reliable Improvement: 61% (range 24% to 73%) Reliable deterioration: 6% (range 3% to 11%) Problem descriptor: 68%* (range <1% to 100%) Average number of sessions: 6.3 (range 2.3 to 9.4) Percent of sessions DNA: 12% (range 5% to 27%) Average wait time: 30 days (range 5 to 154 days) Notes: * up from 62% in 2013/14. ** data completeness issues, true low probably 30%
 (47.9% Jan16) Reliable Improvement: 61% (range 24% to 73%) Reliable deterioration: 6% (range 3% to 11%) Problem descriptor: 68%* (range <1% to 100%) Average number of sessions: 6.3 (range 2.3 to 9.4) Percent of sessions DNA: 12% (range 5% to 27%) Average wait time: 30 days (range 5 to 154 days) Notes: * up from 62% in 2013/14. ** data completeness issues, true low probably 30%.")
62
Enhancing Service Improvement and Recovery rates How? Lessons from analysis of national data Service innovation projects Clinical Leadership Public Health England “Common Mental Disorders Profiles Tool”

63
Lessons from analysis of national data (Gyani et al, 2013. IAPT Year one) Services with higher recovery rates Higher average number of sessions Use stepped care appropriately Core of experienced staff NICE compliant treatment Self-referral (less sessions to recovery) Initial severity also predicts recovery
 Services with higher recovery rates Higher average number of sessions Use stepped care appropriately Core of experienced staff NICE compliant treatment Self-referral (less sessions to recovery) Initial severity also predicts recovery.")
64
IAPT Year 7 A wealth of local information on IAPT services is available in HSCIC’s 3 rd Annual Report (2014/15) and more will be available in the 4 th Annual Report (due in the autumn) Shows availability of therapies and patient experience data for first time. Makes it possible to explore a range of predictors of clinical outcomes using multiple regression.

65
Patient Experience Questionnaire: Tables 17a, b, c Post-treatment Questions % Most or All Times Staff listened to you and treated concerns seriously? 96.7 Service helped you better understand and address your difficulties? 91.5 Felt involved in making choices about your treatment and care? 93.3 Got the help that mattered to you? 91.4 Have confidence in your therapist and their skills? 95.8 Clearly, very positive but note that PEQ was only completed by 11% (50,937) of patients who had finished a course of treatment Post Assessment Questions YES (%) Given information about options for choosing a treatment? 92.3 Did you have a treatment preference? 77.6 Were you offered your preference? 77.8 YES (4.2 NO 14.4 n/a) Satisfied with your assessment? 73.7* (23.8 NO) Between 57,000 and 74,000 responses, which is less than 10%. * Completely or mostly satisfied
 of patients who had finished a course of treatment Post Assessment Questions YES (%) Given information about options for choosing a treatment Did you have a treatment preference Were you offered your preference YES (4.2 NO 14.4 n/a) Satisfied with your assessment. 73.7* (23.8 NO) Between 57,000 and 74,000 responses, which is less than 10%. * Completely or mostly satisfied.")
66
Which Therapies are available? Therapy TypeCCG s CBT211 Counselling180 IPT141 Couples95 DIT77 Employment Support 59 Other Hi185 85% of CCGs offer CBT and Counselling (universal offer) 96% of CCGs offer at least 2 High intensity therapies, 75% offer at least 3, 48% offer at least 4 of 5 High intensity therapies But capacity for Couples, IPT and DIT needs to increase (plans in place)
 96% of CCGs offer at least 2 High intensity therapies, 75% offer at least 3, 48% offer at least 4 of 5 High intensity therapies But capacity for Couples, IPT and DIT needs to increase (plans in place).")
67
Model for Reliable Improvement (predicts 62% of variability) PredictorBetasignificanc e Problem descriptor completeness (%).112<.05 Average number of sessions.097<.05 Average wait time -.166<.001 DNA rate (% of sessions) -.105<.05 Percent of patients who get a course of treatment.201<.001 Paired score completeness.505<.001 Number of patients who are seen -.096<.05 Social deprivation of CCG -.061.170 Note. Bold indicates predictor adds significantly to the model

68
Plan, Do, Study, Act. An Example of using data to improve outcomes (John Pimm, Bucks IAPT service )
")
69
Recovery and Number of Sessions by Problem Descriptor (Tables 9e & 4) Problem DescriptorRecovery Rate (%) No of Sessions Specific Phobia 62.7 7.8 GAD 55.2 6.4 Panic Disorder 53.0 6.7 OCD 47.6 9.4 Mixed Anx & Dep 44.5 6.2 Depression 44.6 6.5 Social Phobia 43.6 8.4 PTSD 37.5 8.5 Agoraphobia 36.2 7.3
 Problem DescriptorRecovery Rate (%) No of Sessions Specific Phobia GAD Panic Disorder OCD Mixed Anx & Dep Depression Social Phobia PTSD Agoraphobia")
70
Improving use of problem descriptors (ICD-10 codes) in a service
 in a service")
71
Is IAPT triage missing some disorders? (Cernis, Pimm & Clark, 2016) Problem DescriptorPWP TriagePDSQ Screener Major Depression48%63% Generalized Anxiety Disorder29%56% Social Anxiety Disorder 7%52% Mixed Anxiety & Depression 6%- Somatization-43% Panic Disorder 2%42% Post-traumatic Stress Disorder 1%40% Agoraphobia 1%37% Obsessive-Compulsive Disorder 1%35% Health Anxiety<1%35%
 Problem DescriptorPWP TriagePDSQ Screener Major Depression48%63% Generalized Anxiety Disorder29%56% Social Anxiety Disorder 7%52% Mixed Anxiety & Depression 6%- Somatization-43% Panic Disorder 2%42% Post-traumatic Stress Disorder 1%40% Agoraphobia 1%37% Obsessive-Compulsive Disorder 1%35% Health Anxiety<1%35%.")
72
Improving Recovery rates: clinical leadership, staff supervision and CPD NHSEngland workshop with some high recovery rate services A consistent theme –Leadership focused on recovery and reliable improvement data in an inquisitive and staff supportive manner –Staff get personal feedback benchmarked against service average or other therapists –Personalized CPD programmes for staff

73
How can commissioners and clinicians see how their service is doing? IAPT has a very rich dataset. Local reports can be generated by services All services upload 50 data items on each patient to HSCIC for central processing each month HSCIC issues reports monthly, quarterly, annually. Public Health England (PHE)’s Common Mental Health Disorders Profiles Tool is the most accessible source for benchmarking.
’s Common Mental Health Disorders Profiles Tool is the most accessible source for benchmarking..")
81
Thames Valley CCGs

85
How can this be achieved? (1) Outcome data on everyone (> 95%)** Wait to treatment low (> 75% start in 6 weeks)** Problems being treated identified in everyone (ICD-10 codes).** Type of Therapy in line with NICE guidance** Adequate dose of therapy in line with NICE guidance** (service average 8-10 sessions per course of treatment) Good use of stepped care** Choice of therapies for depression (CBT, IPT, couples therapy, counselling, brief psychodynamic). Just CBT for anxiety.
 Outcome data on everyone (> 95%)** Wait to treatment low (> 75% start in 6 weeks)** Problems being treated identified in everyone (ICD-10 codes).** Type of Therapy in line with NICE guidance** Adequate dose of therapy in line with NICE guidance** (service average 8-10 sessions per course of treatment) Good use of stepped care** Choice of therapies for depression (CBT, IPT, couples therapy, counselling, brief psychodynamic). Just CBT for anxiety..")
86
What should a good IAPT look like? Access 15% or more Majority of patients have course of treatment Adequate dose of therapy in line with NICE Recovery rates 50% or more Reliable improvement higher

87
How can this be achieved? (2) Adequate size workforce Core of experienced staff (at least third) Excellent clinical leadership –Recovery focused –Attention to service and therapist outcomes (feedback) –Create inquisitive, supportive, work environment –Weekly helpful supervision for all staff –Tailored CPD programme for staff
 Adequate size workforce Core of experienced staff (at least third) Excellent clinical leadership –Recovery focused –Attention to service and therapist outcomes (feedback) –Create inquisitive, supportive, work environment –Weekly helpful supervision for all staff –Tailored CPD programme for staff.")
88
Thank You

89
IAPT Maintenance Release Paul Ellingham – Data Manager, HSCIC Community and Mental Health Team, HSCIC

90
Why do a maintenance release? Version 1.5 is well established and collecting good data Some minor issues from v1.5 need tidying up Some important loopholes need to be closed An opportunity to add some new functionality 90

91
What do we plan to include? 91 GMPC code submissions New appointment table inclusion rules New appointment table validation Empty appointment table warning Minor technical processing fix Diagnostic corrections Derivation corrections Stripping of ENDDATEs Minor display fix Replace Data Depot Handling of spaces Ban Duplicate NHS numbers Handling negative scores

92
What do we plan to include? 92 GMPC code submissions Some back-end changes to the portal and data processing to allow the longer GMPC codes to be submitted as the ORGCODEPROVIDER

93
What do we plan to include? 93 New appointment table inclusion rules New appointment table validation Empty appointment table warning At least one appointment must be in the reporting period if there are any appointments present Appointment table is allowed to be empty in the IDB, but a warning will be given No longer possible to submit duplicate date/time combinations (for attended appointments)
.")
94
What do we plan to include? 94 Minor technical processing fix Ban These are issues for HSCIC, but have little to no effect for providers

95
What do we plan to include? 95 Diagnostic corrections Derivation corrections Stripping of ENDDATEs Minor display fix Replace Data Depot Handling of spaces Duplicate NHS numbers Handling negative scores These will all affect providers, though to greater or lesser degree

96
What do we plan to include? 96 Diagnostic corrections These will all affect providers, though to greater or lesser degree Diagnostic on attended appointment actually includes ALL appointments, so will be corrected. Issue with GP Practice Code diagnostic to be fixed

97
What do we plan to include? 97 Derivation corrections These will all affect providers, though to greater or lesser degree Currently the first/last type derivations in the post-deadline extracts are over- sensitive to the quality of the data Fixes to bring these closer to the IC_ derivations used for publication are planned

98
What do we plan to include? 98 Stripping of ENDDATEs These will all affect providers, though to greater or lesser degree Currently ENDDATEs after the end of the reporting period are stripped Changes to be made to ensure the ENDCODE is also removed where this happens

99
What do we plan to include? 99 Minor display fix Handling of spaces Duplicate NHS numbers Handling negative scores These will all affect providers, though to greater or lesser degree These will have a small effect only

100
What do we plan to include? 100 Replace Data Depot These will all affect providers, though to greater or lesser degree My personal crusade!

101
Effect on Providers of Data GP providers will be able to submit using their practice code Current users –New validations could cause file rejections, but this would be to prevent major loss of data –Cancelled appointments that are re-booked will be able to flow, but duplicate attended appointments prevented –Corrections to diagnostic information –Mitigation of DQ on derivations in the post-deadline extract –DQ reports available to download from portal instead of data depot 101

102
Timings To be finalised, but planned for Autumn 2016 102

103
Questions and Answer Session

104
Summary and Close

Similar presentations


 in London - Implementing NICE Guidance Professor Stephen Pilling PhD Director, National Collaborating.>")


 in London>")


 Research.>")
