Download presentation
Presentation is loading. Please wait.

1
Topics In Social Computing (67810) Module 1 Introduction & The Structure of Social Networks
 Module 1 Introduction & The Structure of Social Networks")
2
Class / Home experiment Who has a Facebook account? Pick a random Facebook “friend”. Is a Facebook “friend” really a friend? Check how many Facebook friends she/he has

3
Questions for thought How strong is your connection? Do you have many friends in common? Who has more friends (you or your friend)? – What influences this? – What would you expect the result to be for the “average” / person? – Are men and women different? Did you pick a friend from the same gender or a different one? Did you pick a friend with the same hair color or a different one?
. – What influences this. – What would you expect the result to be for the average / person. – Are men and women different. Did you pick a friend from the same gender or a different one. Did you pick a friend with the same hair color or a different one .")
4
STRUCTURE NETWORKS AS GRAPHS

5
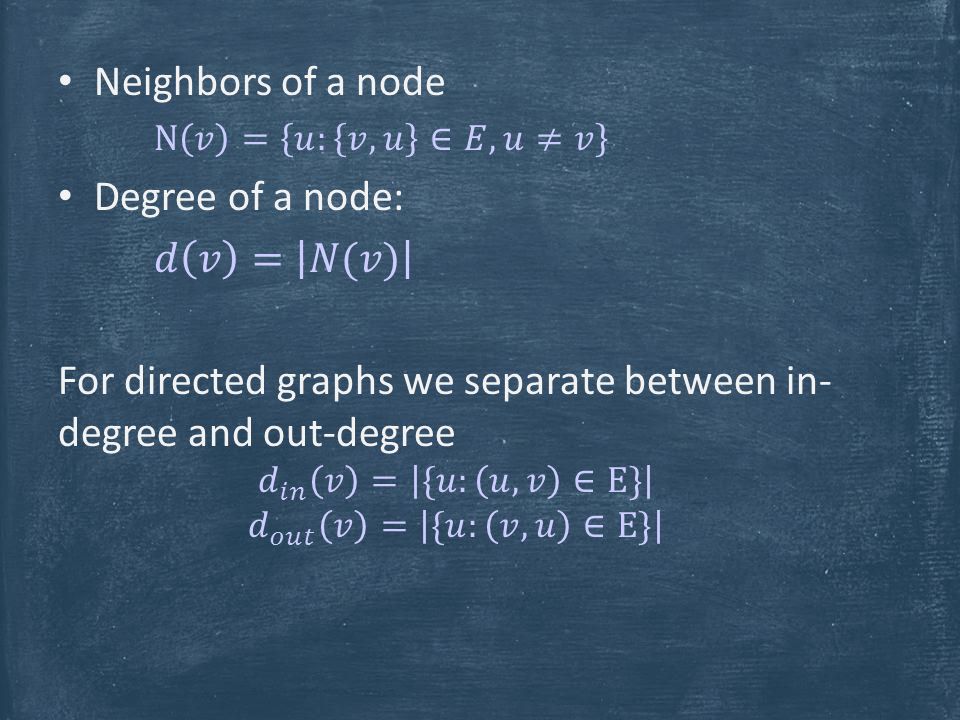
Notation: Graphs

6
Undirected graphs uw v

7
Directed graphs uw v

8
Graphs have limitations that we will often ignore, but you shouldn’t forget: When do we place an edge? Strong / weak ties Undirected graphs: are relations really symmetric? Different types of connections Only represent relations between pairs. What about trios or more? Are both parties along an edge aware of the relationship it represents? Content (emails sent, content of webpages, other characteristics of edges/vertices)
.")
9
Caltech Facebook network (2005) Still, full of data & hard to visualize
 Still, full of data & hard to visualize")
11
DO YOUR FRIENDS HAVE MORE FRIENDS THAN YOU? 11

12
Why your friends (probably) have more friends than you 12
 have more friends than you 12")
13
Why your friends (probably) have more friends than you 13
 have more friends than you 13")
14
A little more notation (Connectivity and cuts)
")
15
uw v

16
2 3 5 4 1 S Example: T

17
SOCIAL NETWORKS: CLUSTERED YET CONNECTED

18
Basic insight about social networks that we will explore from several angles: Social networks – are quite sparse – are highly “clustered” – tend to be “very well connected”

19
Triadic Closure Empirical evidence suggests: two friends (v,w) of a given individual (u) have an increased chance of being friends themselves. Many possible explanations: – Friends share same environment – Mutual friend introduces them – Attraction to similar people (Homophily) uw v
 uw v.")
20
“Clustering and preferential attachment in Growing networks” M. E. J. Newman Scientific collaboration networks in Physics and Biology Probability of collaboration of scientists as a function of the number of previous mutual collaborators:

21
TouchGraph Visualization of Facebook friends and their friendships Notice the highly clustered structure…

22
Clustering coefficient

23
Example 1 1 3 2 4 5

24
Example 2 2 3 5 4 1

25
Clustering Coefficient

26
“The Anatomy of the Facebook Social Graph” Ugander et. al.

27
Birds of a feather flock together Homophily: The tendency of individuals to associate with “similar” individuals Studied since the 1920s in many contexts. Similarity: age, sex, ethnic background Links between similar individuals form more often, last longer and are more significant.

28
Examples: Similar age: Similar # of friends: From: “The Anatomy of the Facebook Social Graph” Ugander et. Al.

29
“Underlying” Similarity Must be careful to isolate the causes of homophily correctly Maybe people are friends with similar individuals simply because everyone in the area is similar? How do we compensate for this?

30
“Friendship in school: Gender and Racial Homophily”, Shrum et. al., Sociology of education 1988. Number of edges we’d expect to cross the cut

31
Racial segregation in high school / middle school social network

32
Mutable vs. Immutable Traits Socialization: choosing similar friends – (these may be similar due to both mutable & immutable traits) Social influence: Becoming more similar to friends (through acquired behavior) – E.g., taking up smoking because of friends (We will discuss the latter more in depth later in the course)
 Social influence: Becoming more similar to friends (through acquired behavior) – E.g., taking up smoking because of friends (We will discuss the latter more in depth later in the course).")
33
Spatial Effects (1) – Low Mobility In populations with low rates of geographic mobility relatives tend to live close to each other. Since relatives share genetic traits, this implies similarity between nearby individuals A strictly biological phenomena. – (niching, speciation, etc.)
.")
34
Spatial Effects (2) – Schelling’s model of spatial segregation Simulated on an n-by-m grid. Each location is connected to its 8 neighbors. Place green / red agents at each grid point randomly, leaving some empty spaces

35
Call an agent “unhappy” if it sees only t=2 neighbors of its color or less. Pick an unhappy agent and move it to a nearby (or random) empty location. Repeat. Agents naturally form segregated clusters. http://jasss.soc.surrey.ac.uk/12/1/6/appendixB/Schelling1969.html
 empty location. Repeat. Agents naturally form segregated clusters.")
36
Spatial Effects (3) Distance & Friendships: The propinquity effect Friends are geographically close Attributed to increased probability of meeting Westgate community study – Housing for married MIT students returning from WW2 – Very homogenous From “Social Pressures in Informal Groups: A Study of Human Factors in Housing” By Leon Festinger, Kurt W. Back, Stanley Schachter

37
Distance#Friendships Max Possible #Friendships (at this dist.) ratio
 ratio")
38
Other physical properties that matter: – Route to apartment (stairs, doors) – Location of mail boxes – etc.
 – Location of mail boxes – etc.")
39
SOCIAL NETWORKS: CLUSTERED YET CONNECTED 39

40
Benefits of Connectivity Information obtained through links is valuable – If you are looking for a job it is beneficial to be connected to many potential sources – Many people find jobs through acquaintances. Tightly knit groups hold roughly the same information. Makes connections leading to other clusters highly valuable. 40

41
Mark Granovetter’s work on job search: – People find jobs through acquaintances Percentage of job finders Distance to job found 39.1%1 45.3%2 12.5%3 3.9%>3 41

42
Usually through weak links: Granovetter argues that weak links help more because they lead to distant parts of the social network. (But what’s missing in the table above?) Chance of getting a JobMeeting freq. with contact 16.7%Often (twice a week or more) 55.6%Occasionally (twice a week to once a year) 27.8%Rarely (once a year or less) 42
 Chance of getting a JobMeeting freq. with contact 16.7%Often (twice a week or more) 55.6%Occasionally (twice a week to once a year) 27.8%Rarely (once a year or less) 42.")
43
Bridges 43

44
Local Bridges A weaker property than a bridge: A local bridge: an edge that connects nodes that are otherwise of distance greater than 2. – A “shortcut” of sorts 3 4 5 2 1 6 7 8 44

45
Connection between weak links and triadic closure Granovetter’s idea: – strong links have triadic closure more often – Triadic closure adds links that reinforce network structure &“ruin” local bridges – Thus bridges are often weak links “The strength of weak links” 3 4 5 2 1 6 7 8 45

46
Connectivity as Social Capital Social capital: The ability to gain benefits through social relations. (Other use of the term: Social capital of a group rather than a person) Prediction: bridges confer an advantage. Hard to test! – Correlation between successful individuals and “bridging individuals” – But is this just the desire to connect to successful individuals? – Connections biased by homophily and selection processes 46
 Prediction: bridges confer an advantage. Hard to test. – Correlation between successful individuals and bridging individuals – But is this just the desire to connect to successful individuals. – Connections biased by homophily and selection processes 46.")
47
Several forms of (individual) social capital: Having many links – (incoming / outgoing links) – Having many links to successful individuals Short distance from many nodes in social network Belonging to / connecting many different communities 47
 social capital: Having many links – (incoming / outgoing links) – Having many links to successful individuals Short distance from many nodes in social network Belonging to / connecting many different communities 47")
Similar presentations


>")

 Roy Mitz Supervised by: Prof. Ronitt Rubinfeld November 2014 Strong and weak.>")


