Download presentation
Presentation is loading. Please wait.

2
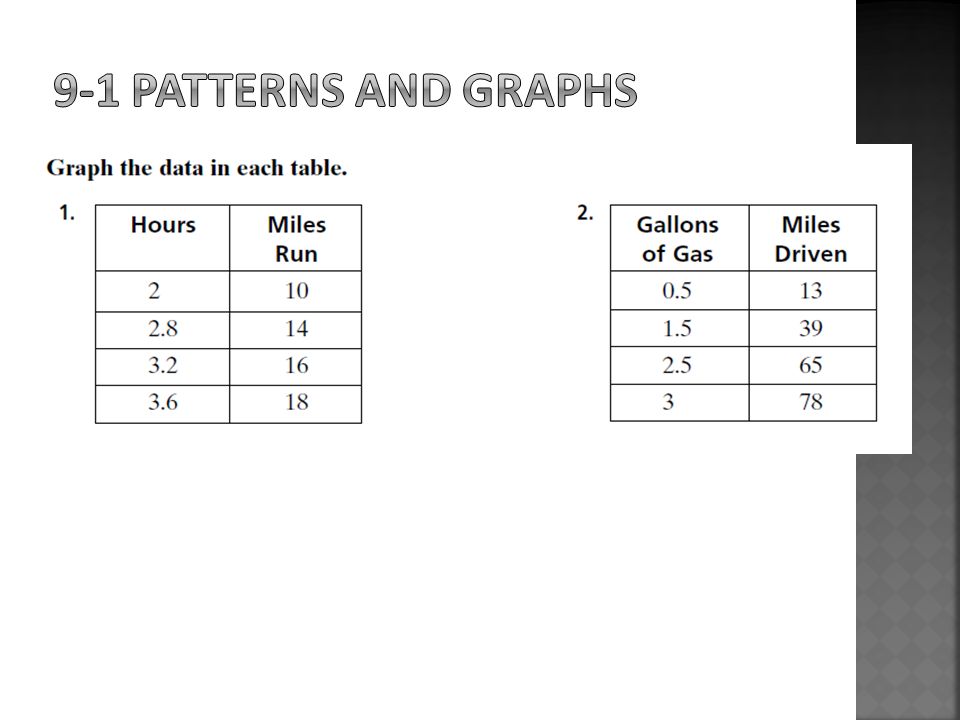
Graphs can help you see patterns in data. Steps to draw a graph: 1)Choose the scales and the intervals. 2)Draw the graph and plot the data. Estimate data points that fall between intervals.
Choose the scales and the intervals. 2)Draw the graph and plot the data. Estimate data points that fall between intervals..")
5
10.About $7 11.About $8 12. About 81 hours

6
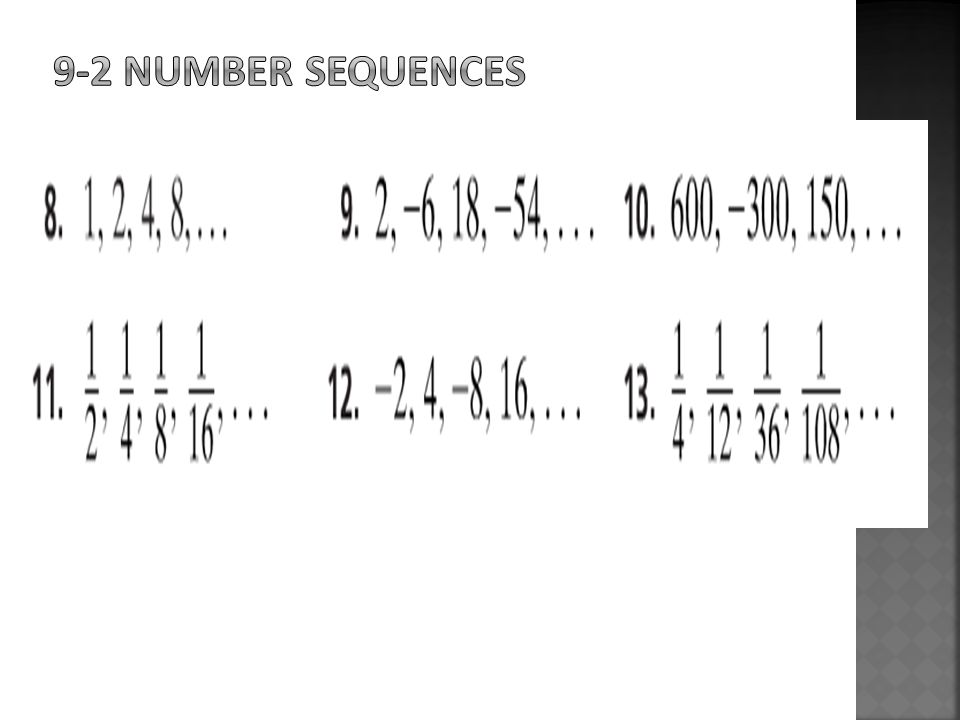
sequence – set of numbers that follow pattern arithmetic sequence – find each term by adding a fixed number (common difference) Example: 3, 5, 7, 9, … geometric sequence – find each term by multiplying previous term by fixed number (common ratio) Example: 3, 9, 27, 81, ……
 Example: 3, 5, 7, 9, … geometric sequence – find each term by multiplying previous term by fixed number (common ratio) Example: 3, 9, 27, 81, ……")
7
The sequence is not arithmetic or geometric if there is no common difference or common ratio. Conjecture – prediction that suggests what you expect to happen Example: 3, 5, 8, 12, 17, …….

9
6. Start with -8 and add 7 repeatedly; 20, 27, 34 7. Start with 25 and add -4 repeatedly; 9, 5, 1

11
8. Start with 1 and multiply by 2 repeatedly; 16, 32, 64 9. Start with 2 and multiply by -3 repeatedly; 162, -486, 1458 10. Start with 600 and multiply by -½ repeatedly; -75, 37.5, -18.75 11. Start with ½ and multiply by ½ repeatedly; 1/32, 1/64, 1/128 12. Start with -2 and multiply by -2 repeatedly; -32, 64, - 128 13. Start with ¼ and multiply by 1/3 repeatedly; 1/324, 1/972, 1/2916

13
14. Neither 15. Neither 16. Geometric 17. Both 18. Geometric 19. arithmetic

14
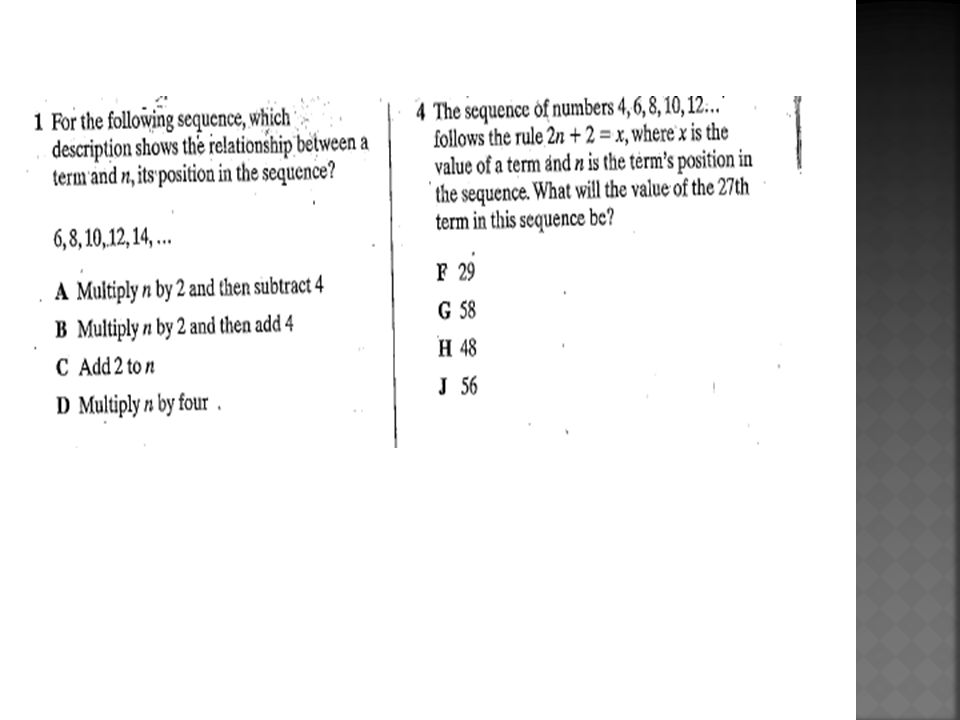
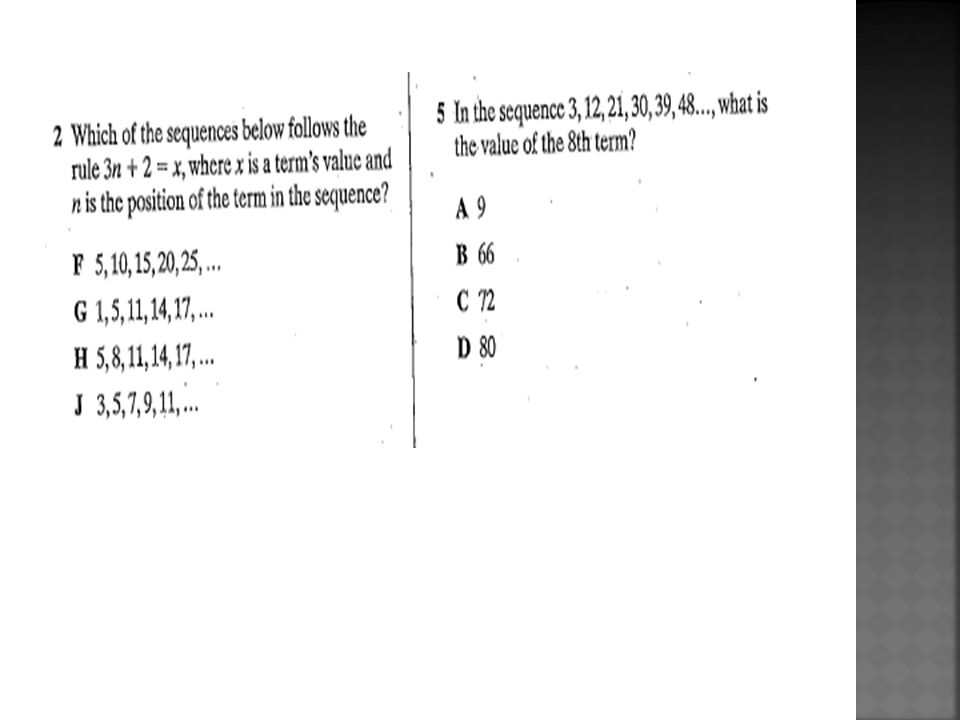
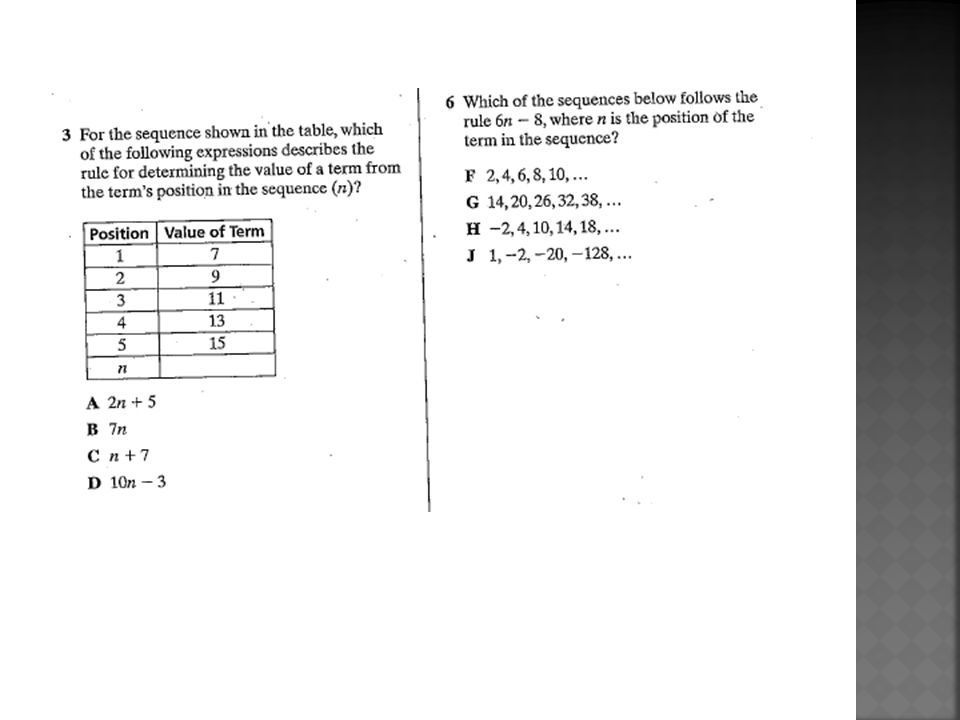
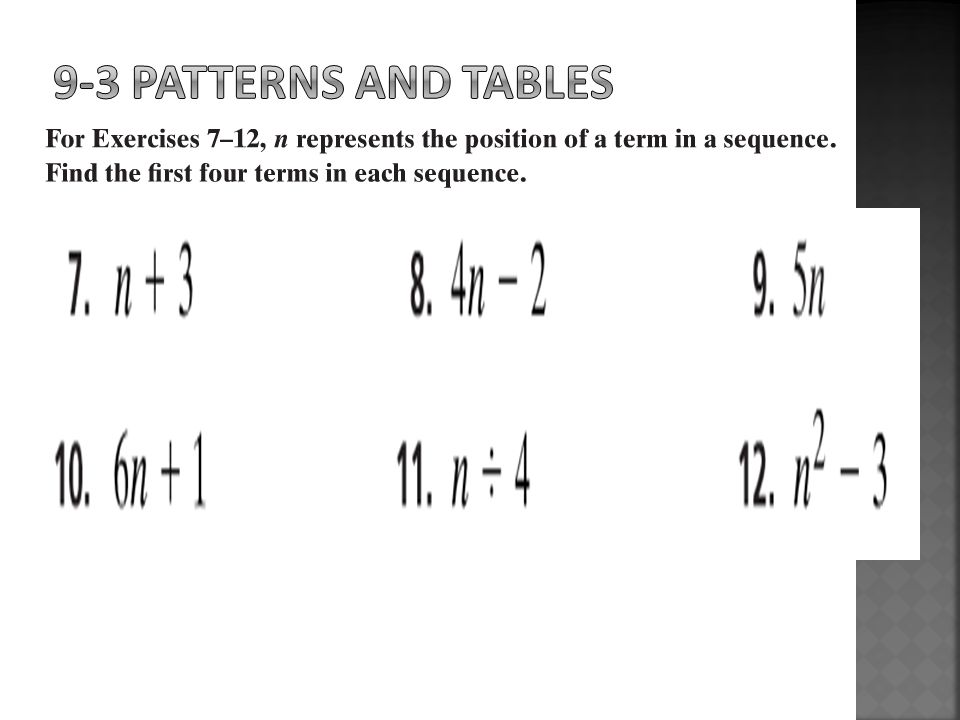
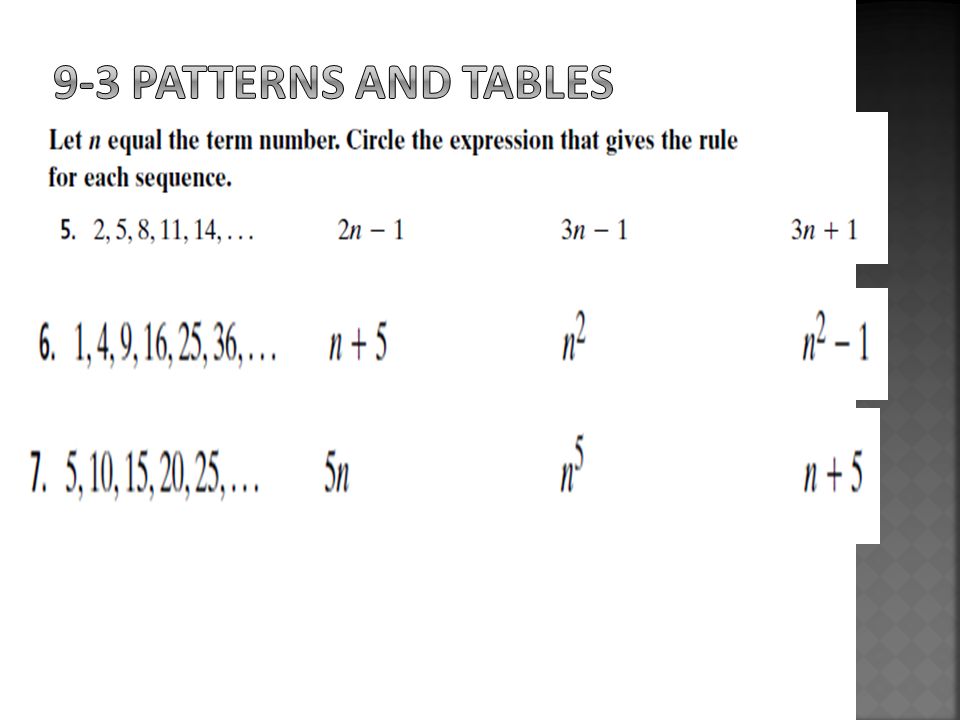
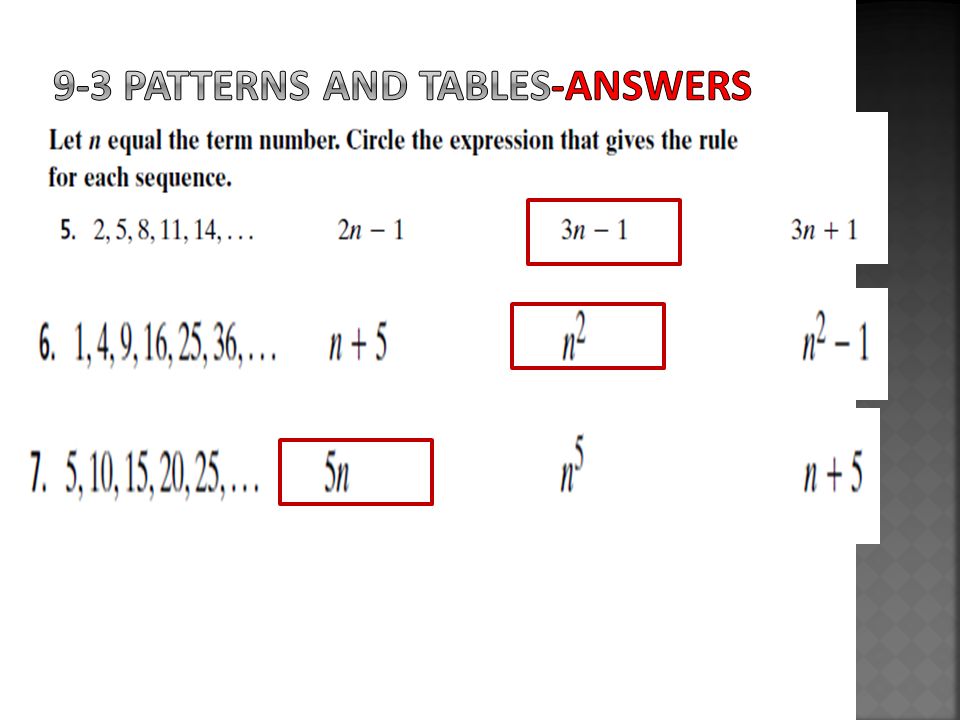
You can use a table to represent a pattern. Often you can make a table as your first step in solving a problem. Given a rule, you can find the value of a term using the position. Let n = the term number.

19
7. 4,5,6,7 8. 2, 6, 10, 14 9. 5, 10, 15, 20 10. 7, 13, 19, 25 11. ¼, ½, ¾, 1 12. -2, 1, 6, 13

21
24, 28 4 4n Multiply each term by 4 24, 28

25
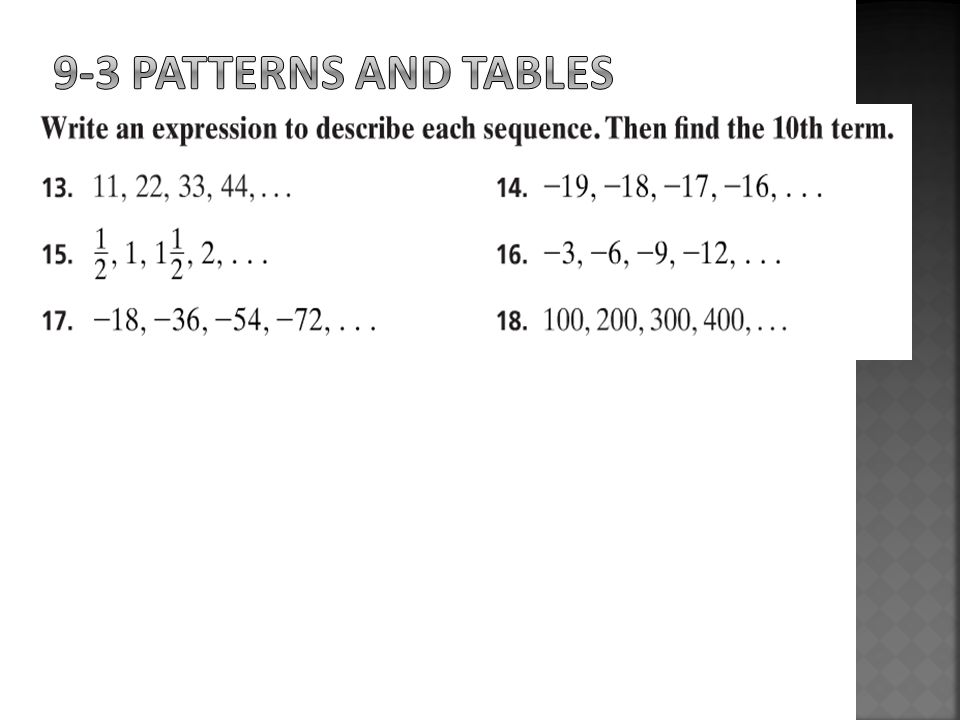
13. 11n; 110 14. N – 20; -10 15. n/2; 5 16. -3n; -30 17. -18n; 180 18. 100n; 1000

26
Function – a relationship that assigns exactly one output value for each input value Distance you travel in car depends on time you drive. X is the input Y is the output

28
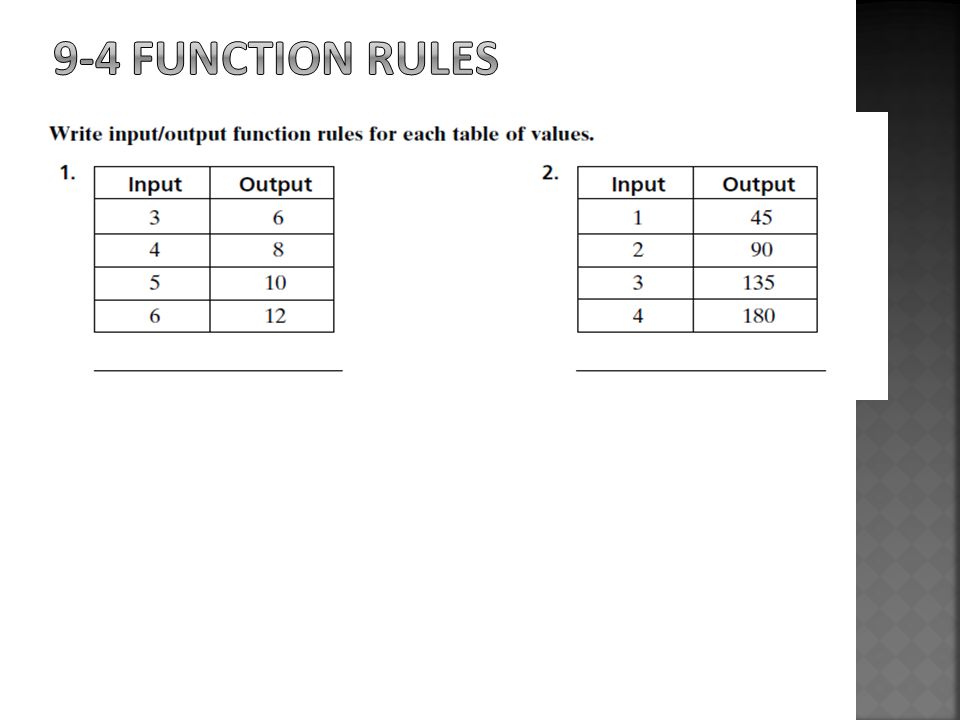
output = 2 * inputoutput = 45 * input

30
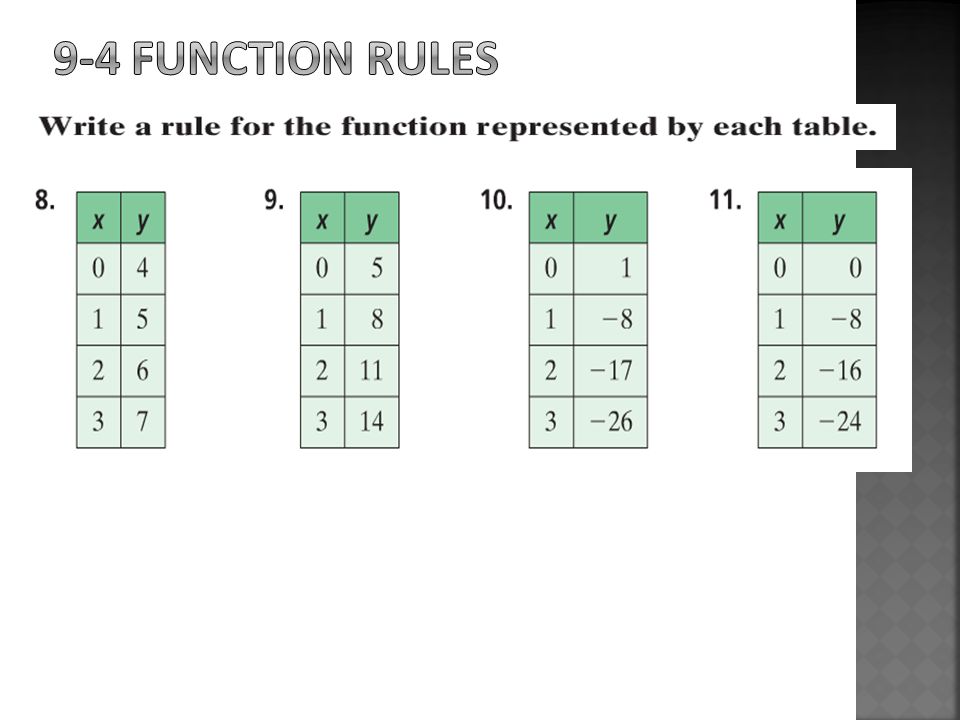
y = x + 4 y = 3x + 5 y = -9x + 1 y = -8x

31
y = x + 4 y = 3x + 5 y = -9x + 1 y = -8x

33
0 10 20 30 -4 -3 -2 2 5 8

35
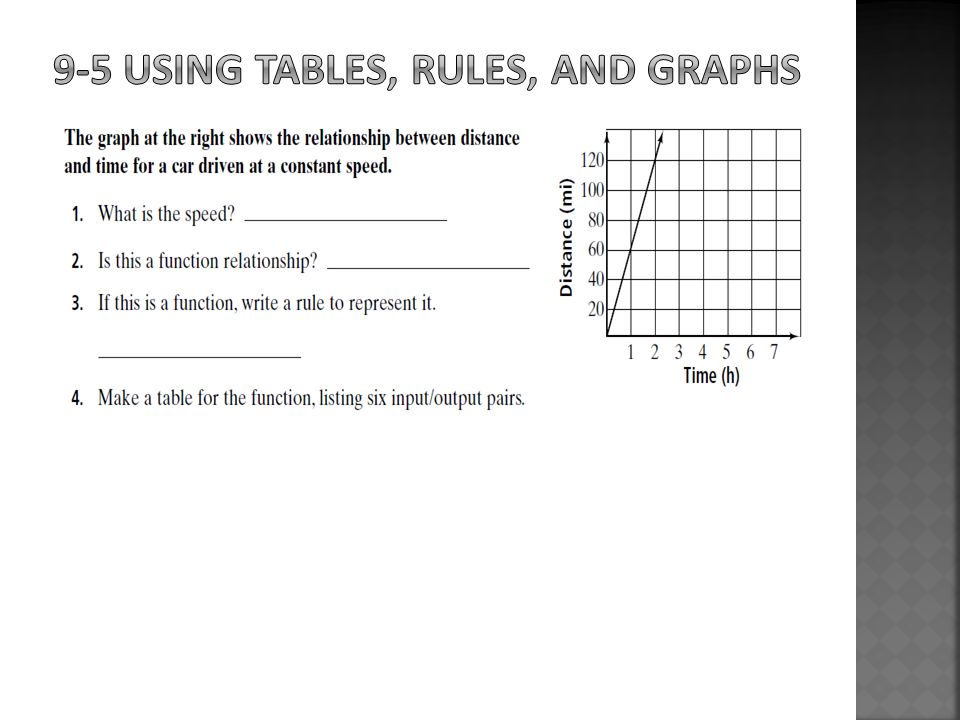
60 mph yes d = 60t Input 1 2 3 4 5 6 Output 60 120 180 240 300 360

37
x12345x12345 y -1/2 -3/2 -2 -5/2 x12345x12345 Y 2 0 -2 -4 -6

39
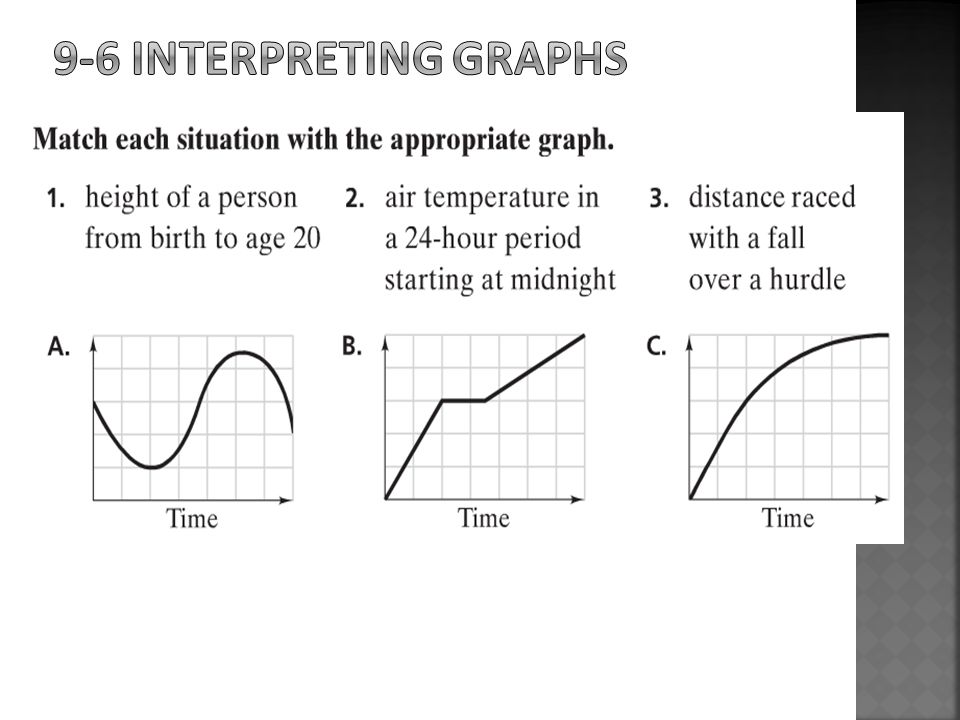
10. C 11. A 12. B

41
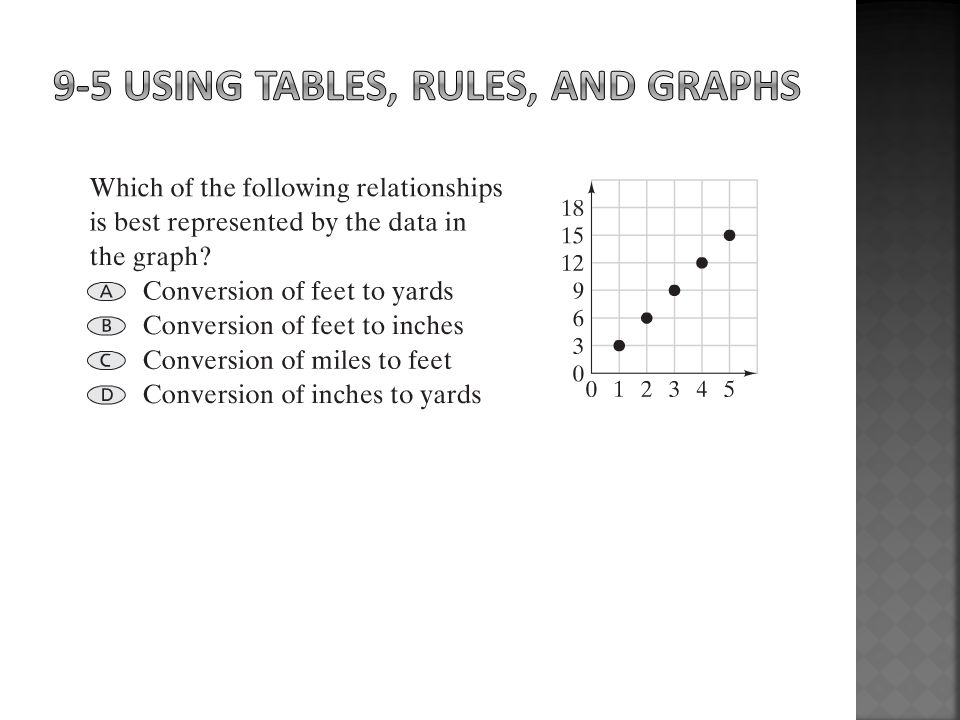
You can use a graph to show the relationship of how one quantity changes compared to another.

44
formula – a rule that shows the relationship between two or more quantities Solve each equation for the variable in red.

45
formula – a rule that shows the relationship between two or more quantities Solve each equation for the variable in red. y = x/z u = 2t - v r = p + 5 3

46
Solve each equation for the variable in red.

47
s =p/4 p = qr s = p + c

48
Solve each equation for the variable in red. h = 2A/b k = hj t = I/pr

Similar presentations


 output(y) ? 5 1 6 2 7 3.>")


