Download presentation
Presentation is loading. Please wait.

1
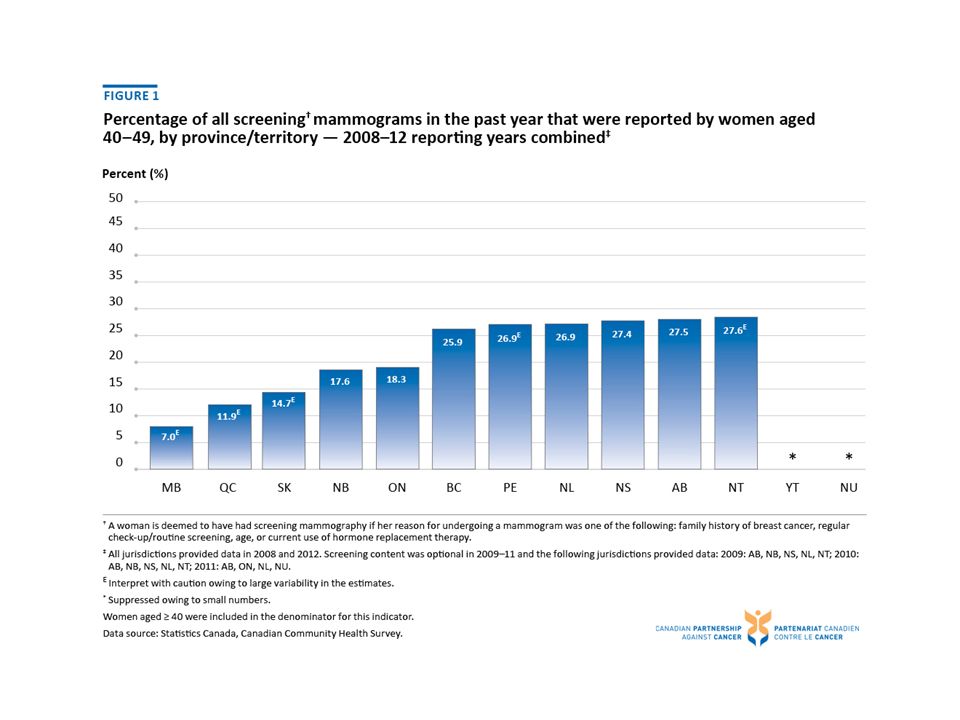
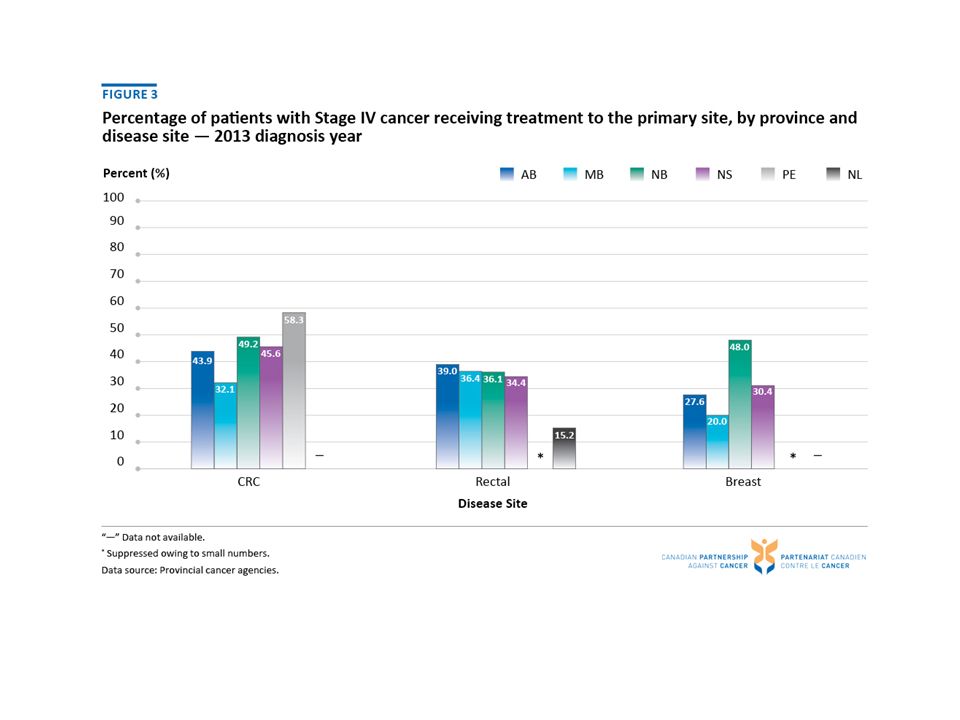
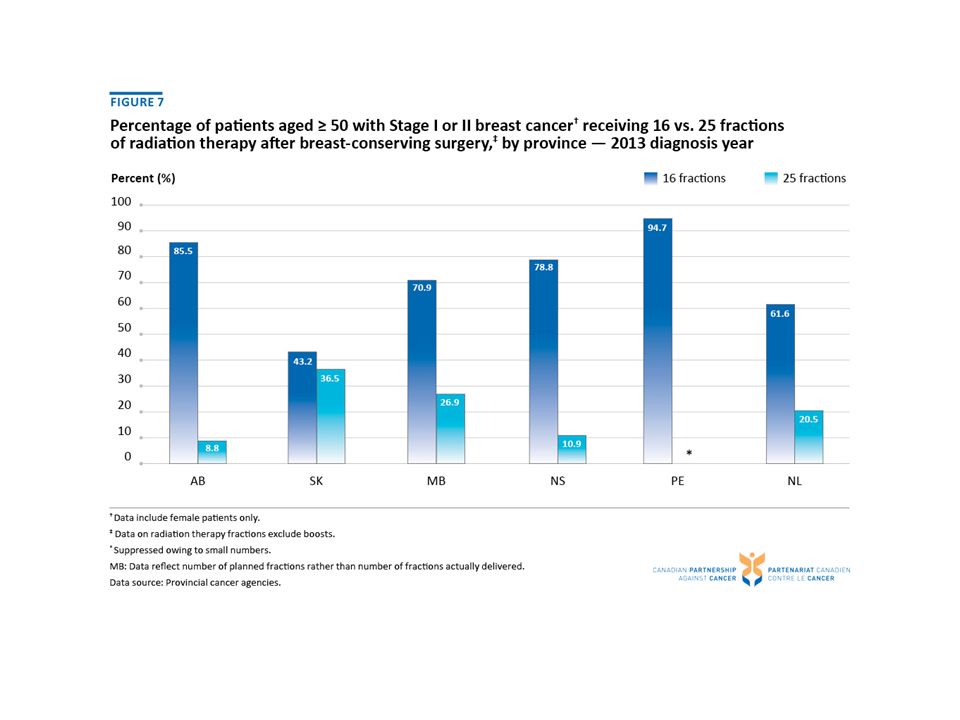
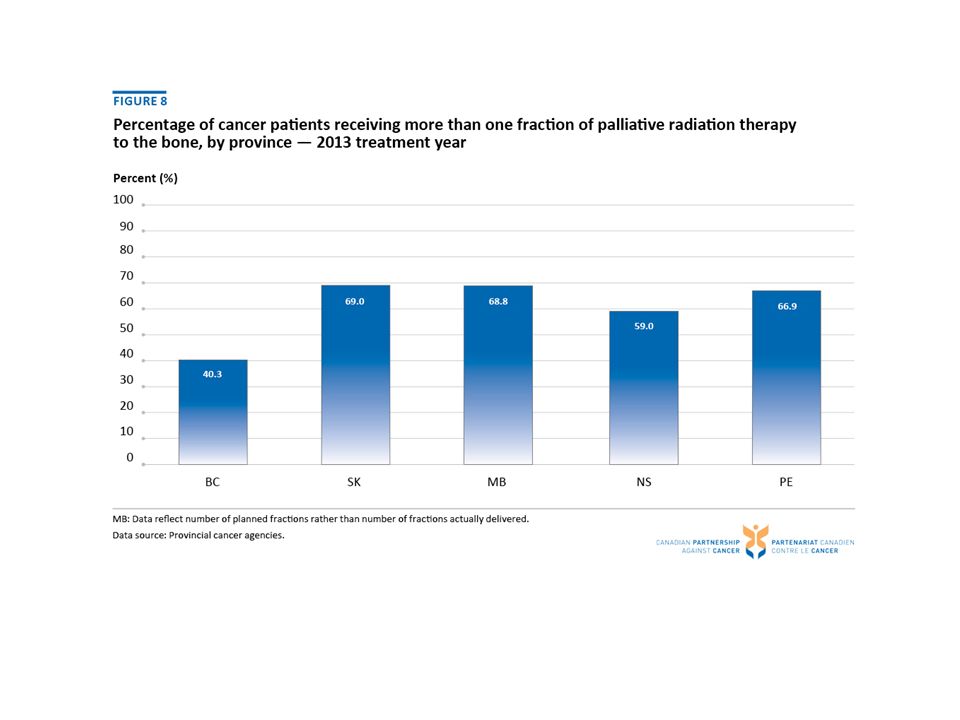
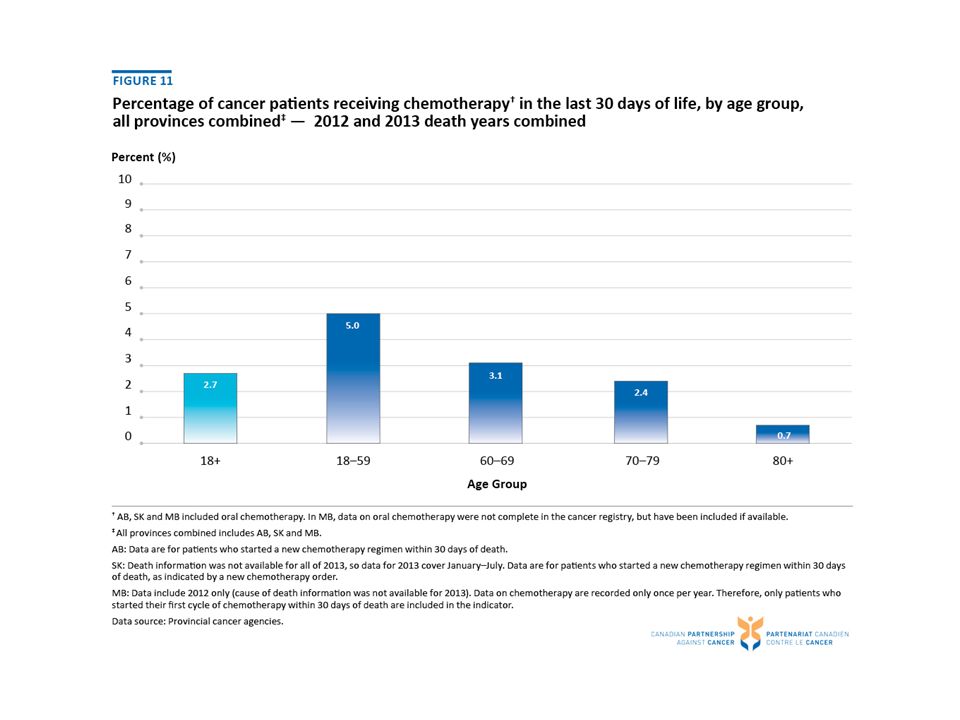
Quality & Sustainability in Cancer Control: A System Performance Spotlight Report To use a hyperlink, right click on it and select ‘Open Hyperlink’, or begin a Slide Show and click on the link. Table 1 Choosing Wisely Canada recommendations and associated performance indicators Figure 1 Percentage of all screening mammograms in the past year that were reported by women aged 40–49, by province/territory — 2008–12 reporting years combined Table 2Percentage of screening mammograms performed in the past year, by age group — 2008–12 reporting years combined Figure 2 Percentage of all Pap tests performed in the past three years that were reported by women outside the recommended age range of 21–69 years, by province/territory — 2008–12 reporting years combined Figure 3 Percentage of patients with Stage IV cancer receiving treatment to the primary site, by province and disease site — 2013 diagnosis year Figure 4 Percentage of patients with Stage IV cancer receiving treatment to the primary site, by disease site and age group, all provinces combined — 2013 diagnosis year Figure 5 Percentage of men with low-risk prostate cancer who received various types of treatment, by province — 2013 diagnosis year Figure 6 Percentage of men with low-risk prostate cancer who had no record of treatment, by year, all provinces combined — 2011, 2012 and 2013 diagnosis years Figure 7 Percentage of patients aged ≥ 50 with Stage I or II breast cancer receiving 16 vs. 25 fractions of radiation therapy after breast-conserving surgery, by province — 2013 diagnosis year Figure 8 Percentage of cancer patients receiving more than one fraction of palliative radiation therapy to the bone, by province — 2013 treatment year Figure 9Percentage of cancer patients receiving palliative radiation therapy to the bone, by number of fractions, all provinces combined — 2013 treatment year Figure 10 Percentage of cancer patients receiving chemotherapy in the last 30 days of life, by province — 2012 and 2013 death years combined Figure 11 Percentage of cancer patients receiving chemotherapy in the last 30 days of life, by age group, all provinces combined — 2012 and 2013 death years combined Figure 12 Percentage of cancer patients admitted to an intensive care unit in the last 14 days of life and percentage dying in an ICU, by province/territories — 2011/12 to 2014/15 fiscal years combined Figure 13 Percentage of breast cancer mastectomies done as day surgery, by province/territories — 2009/10 to 2013/14 fiscal years combined Figure 14 Percentage of breast cancer mastectomies done as day surgery, by province/territories — 2008/09–2010/11 vs. 2011/12–2013/14 fiscal years combined

Similar presentations


: Department.>")


