Download presentation
Presentation is loading. Please wait.

1
Proteomics 2015 蛋白質體學 Protein Analysis 陳威戎 2015. 11. 02

3
O O O O O O O O H H H H H H H H H H H + N N N N N N N N N C C C C C C C C C C C C C C C C C C O O - R R R R R R R ■ 蛋白質構造的骨架: R COO - R group H3NH3N + H N-C-C-N-C-C-N-C-C OOO

4
Cu 2+ Cu + 活性區 COCO NH 2 H2NH2N 尿素 urea ■各種蛋白質定量法原理:■各種蛋白質定量法原理: -N=N- -NH- -OH-SO 3 - SO 3 - Coomassie Brilliant Blue G 4 5 Specific Binding Group M 3 1 2 206 nm (carbonyl) 280 nm (aromatic) UV Absorbance Biuret Methods (carbonyl) Lowry Methods Phosphomolybdic- phosphotungstate Fe -N=N- -NH- -OH-SO 3 - SO 3 - Metal Tyr Arg Lys Heme R O O O O O O O O H H H H H H H H H H H + N N N N N N N N N C C C C C C C C C C C C C C C C C C O O - R R R R R R R R C C C C HN NH 2 C NH 2 + C C C C NH 3 + C OH..
 280 nm (aromatic) UV Absorbance Biuret Methods (carbonyl) Lowry Methods Phosphomolybdic- phosphotungstate Fe -N=N- -NH- -OH-SO 3 - SO 3 - Metal Tyr Arg Lys Heme R O O O O O O O O H H H H H H H H H H H + N N N N N N N N N C C C C C C C C C C C C C C C C C C O O - R R R R R R R R C C C C HN NH 2 C NH 2 + C C C C NH 3 + C OH..")
5
■ Bradford Method : Coomassie Brilliant Blue G-250 加入蛋白質 酸性環境下呈茶色與蛋白質結合變藍色 CBG 是一種指示劑 470 nm595 nm

6
■ BCA (bicinchoninic acid) method :
 method :")
11
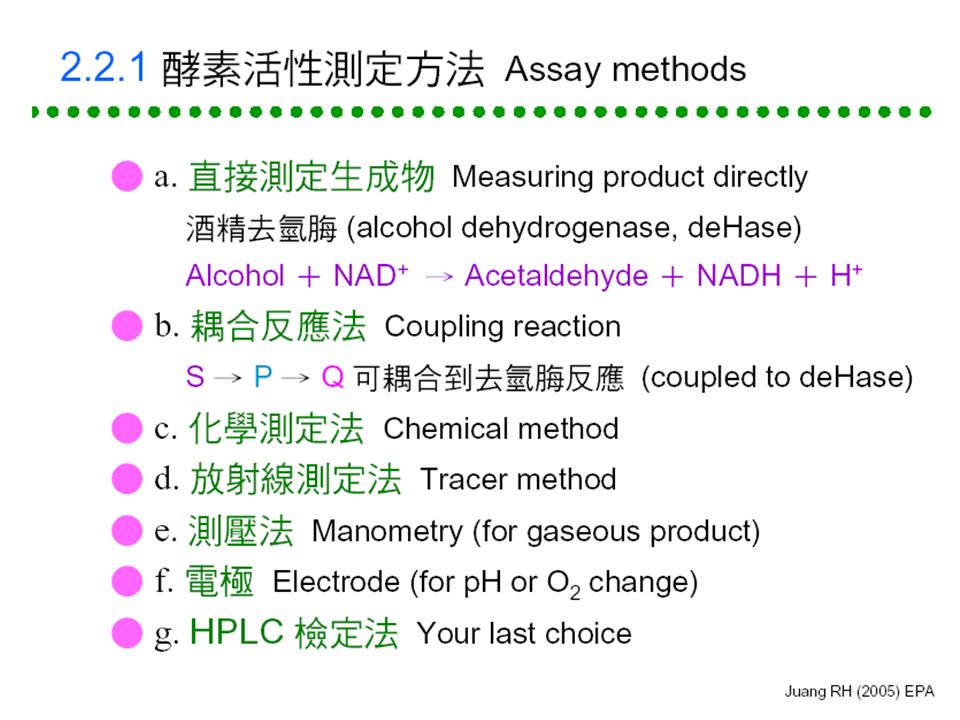
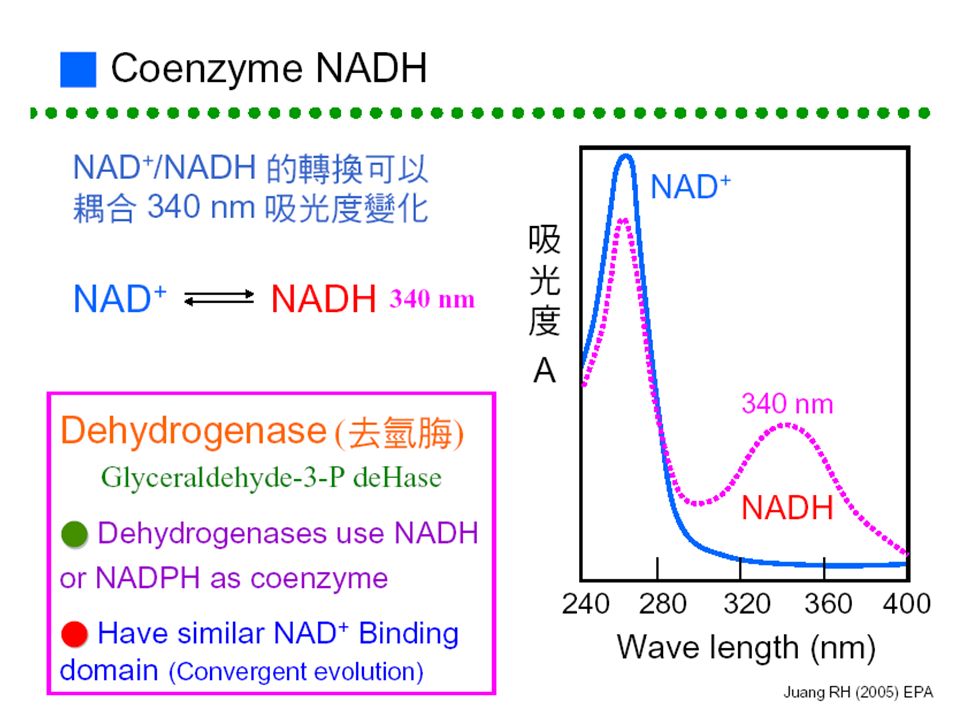
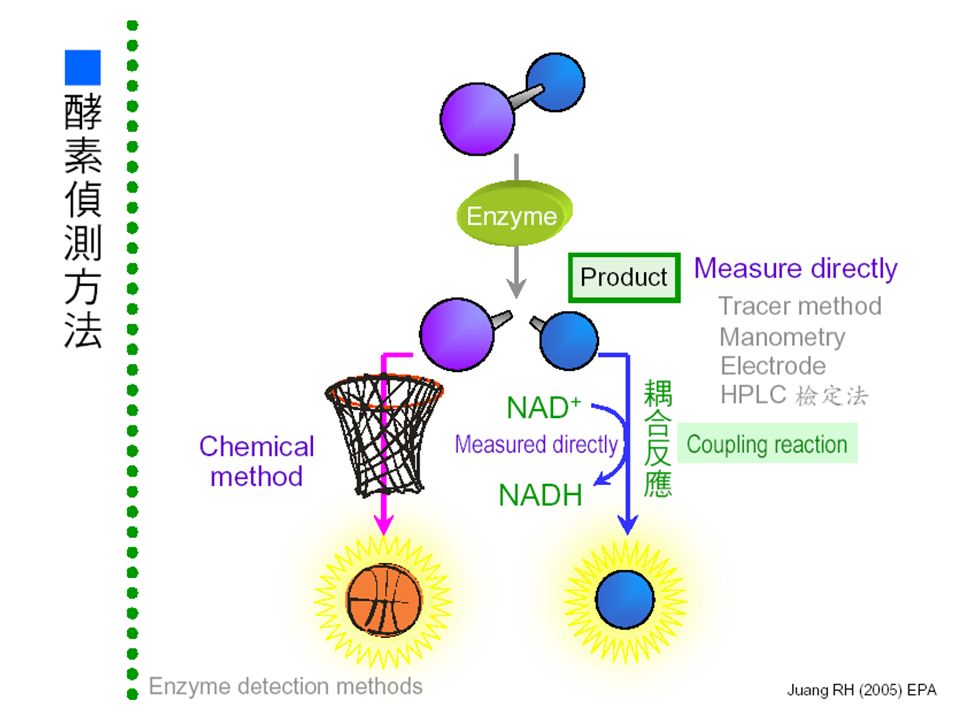
■酵素反應及偵測方法:■酵素反應及偵測方法: 能否直接測量? 把生成物再轉換成 可被測量的生成物 移除生成物並 轉成可測量者 直接測量 生成物可能有 回饋抑制 使用大量反應物 10 x K m 生成物 反應物 酵素 NAD + NADH - -

14
■ 測定時間內反應速率需成線性: Product Time p t p t v = t 正確速率 不正確速率

42
1. Circular Dichroism (CD) 2. X-ray Crystallography 3. Nuclear Magnetic Resonance (NMR) 4. Cryo-Electronic Microscopy (Cryo-EM) 3 蛋白質結構測定方法 Methods for determining protein structure
 4. Cryo-Electronic Microscopy (Cryo-EM) 3 蛋白質結構測定方法 Methods for determining protein structure.")
43
Circular Dichrosim (CD) Spectroscopy - Introduction 1. When plane polarized light passes through a solution containing an optically active substance the left and right circularly polarized components of the plane polarized light are absorbed by different amounts. 2. When these components are recombined they appear as elliptically polarized light. The ellipticity is defined as . 3. CD is the ellipticity (difference) in absorption between left and right handed circularly polarized light that measured with spectropolarimeter. 4. Proteins and nucleic acids contain elements of asymmetry and thus exhibit distinct CD signals.
 in absorption between left and right handed circularly polarized light that measured with spectropolarimeter. 4. Proteins and nucleic acids contain elements of asymmetry and thus exhibit distinct CD signals..")
44
The principle behind CD spectroscopy The light from UV1 is passed into a Photo Elastic Modulator (PEM) which converts the linear polarized light into alternating left and right handed polarized light. The two polarizations are differently absorbed, and the difference in absorption is detected with a Photo Multiplier Tube (PMT)
.")
45
Polarization Vertically Polarised Light Horizontally Polarised Light Left Circularly Polarised (LCP) Light Right Circularly Polarised (RCP) Light
 Light Right Circularly Polarised (RCP) Light")
46
Spectropolarimeter

47
Cuvette for Circular Dichroism

48
Far-UV (180-250 nm) CD for determining protein secondary structure The far-UV CD spectrum of proteins can reveal important characteristics of their secondary structure.secondary structure CD cannot say where the alpha helices that are detected are located within the molecule or even completely predict how many there are. It can be used to study how the secondary structure of a molecule changes as a function of temperature or of the concentration of denaturing agents, e.g. Guanidinium chlorideor urea, thus revealing important thermodynamic information about the molecule.Guanidinium chlorideurea Anyone attempting to study a protein will find CD a valuable tool for verifying that the protein is in its native conformation before undertaking extensive and/or expensive experiments with it.

49
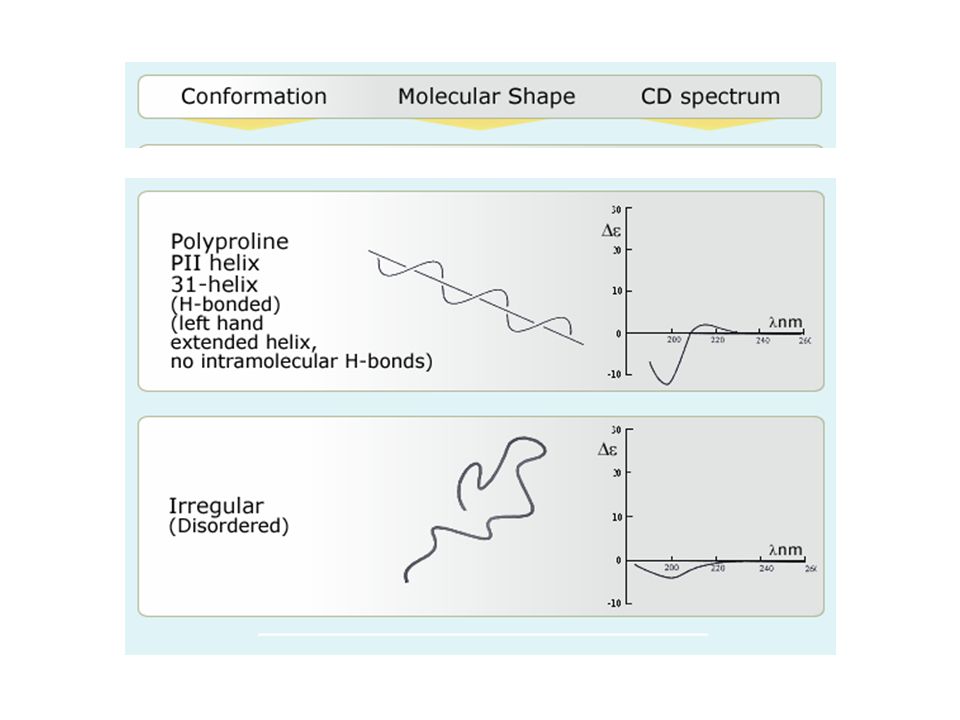
Far-UV (180-250 nm) CD for determining protein secondary structure Secondary Structure Signal (+/-) WL (nm) -helix +190-195 -208 -222 -sheet +195-200 -215-220 random-200 coil+220
 CD for determining protein secondary structure Secondary Structure Signal (+/-) WL (nm) -helix -sheet random-200 coil+220")
50
CD spectra measurement Path length: 1 mm Concentration: 0.2mg/ml Temp.: 20ºC Wavelength: 260-185 nm Scan speed: 100 nm/min Data interval: 0.1 nm Bandwidth: 1 nm Measurement: 90 sec. per sample

51
Near-UV (250-350 nm) CD is dominated by aromatic amino acids and disulfide bonds The near-UV CD spectrum (>250 nm) of proteins provides information on the tertiary structure.tertiary structure The signals obtained in the 250–300 nm region are due to the absorption, dipole orientation and the nature of the surrounding environment of the phenylalanine, tyrosine, cysteine (or S-S disulfide bridges) and tryptophan.disulfide bridges Unlike in far-UV CD, the near-UV CD spectrum cannot be assigned to any particular 3D structure. Rather, near-UV CD spectra provide structural information on the nature of the prosthetic groups in proteins, e.g., the heme groups in hemoglobin and cytochrome c.hemoglobincytochrome c

52
Near-UV (250-350 nm) CD is dominated by aromatic amino acids and disulfide bonds a.a. residue Abs max. (nm) Phe 254, 256 262, 267 Tyr 276 Trp282 Disulfides250-300 broad band
 Phe 254, , 267 Tyr 276 Trp282 Disulfides broad band.")
56
Circular Dichrosim (CD) Spectroscopy - Applications 1. Secondary structure content of macromolecules 2. Conformation of proteins and nucleic acids - Effects of salt, pH, and organic solvents 3. Kinetics - Protein folding, unfolding, denaturation or aggregation 4. Thermodynamics - Protein stability to temperature or chemical denaturants

57
Circular Dichrosim (CD) Spectroscopy
 Spectroscopy")
58
Loss of protein structure results in loss of function Protein Denaturation and Folding

59
Methods for determining the three-dimensional structure of a protein: X-ray crystallography

60
Determining the three-dimensional structure of a protein: X-ray crystallography

61
Protein crystallization techniques

62
Protein crystallization techniques

63
Typical protein crystals

64
X-ray diffractometer

67
Methods for determining the three-dimensional structure of a protein: X-ray crystallography Protocols: 1. Protein over-expression and purification 2. Protein crystallization 3. X-ray diffraction 4. Phase determination and electron density maps 5. Model building and refinement Advantages: 1. Best resolution 2. No size limitation (in contrast to NMR) Limitations: Technically very challenging to make crystals of proteins. (heterogeneous samples, membrane proteins, protein complexes)
 Limitations: Technically very challenging to make crystals of proteins. (heterogeneous samples, membrane proteins, protein complexes).")
68
Methods for determining the three-dimensional structure of a protein: Nuclear magetic resonance, NMR

69
Protocols: 1. A concentrated aqueous protein sample (0.2-1 mM, 6-30 mg/mL) labeled with 13 C and/or 15 N is placed in a large magnet. 2. An external magnetic field is applied; 13 C and 15 N nuclei will undergo precession (spinning like a cone) with a frequency that depends on the external environment 3. From these frequencies, computer determines the through-bond (J coupling) and through-space (NOE) constants between every pair of NMR-active nuclei. 4. These values provide a set of estimates of distances between specific pairs of atoms, called "constraints“ 5. Build a model for the structure that is consistent with the set of constraints
 labeled with 13 C and/or 15 N is placed in a large magnet. 2. An external magnetic field is applied; 13 C and 15 N nuclei will undergo precession (spinning like a cone) with a frequency that depends on the external environment 3. From these frequencies, computer determines the through-bond (J coupling) and through-space (NOE) constants between every pair of NMR-active nuclei. 4. These values provide a set of estimates of distances between specific pairs of atoms, called constraints 5. Build a model for the structure that is consistent with the set of constraints.")
72
Methods for determining the three-dimensional structure of a protein: Nuclear magetic resonance, NMR Advantages: 1. Native like conditions – sample is hydrated, not in a crystal lattice 2. Can get dynamic information – observe conformational changes 3. Can look at relative disorder of specific regions of a protein – can see if a loop is static or flexible over time Limitations: 1. Not as high resolution as x-ray 2. Require a lot of protein to get a good signal 3. Require very concentrated samples (can get insoluble aggregates) 4. Limit on protein size measurable, since molecule must tumble rapidly to give sharp peaks. Typically, proteins must be <30kD.
 4. Limit on protein size measurable, since molecule must tumble rapidly to give sharp peaks. Typically, proteins must be <30kD..")
Similar presentations


 are made up of alternating single.>")


 - C 1, C s, C i Cyclic (rotational) -C n, C nv, C nh, S n Dihedral ( ⊥ C 2 ) ->")
 Made of a verity.>")


