Download presentation
Presentation is loading. Please wait.

1
Auditing data management system Bruno Deprez Data Audit officer SPC, Oceanic Fisheries Program

2
What is data management audit? Definition: “…a formal, often periodic examination and checking of data or procedures to verify their correctness…” “Audit” term is often used in financial and accounting sectors – To evaluate organization and people – To validate the official financial results of an organization before publication Fishing data management audit purpose is different. The final objective is to improve the quality level of data entered in country in order to make the studies based on this data easier and better To achieve this objective, we need to ensure the correctness and the coverage of the data, throughout systemic and non-systemic audit This audit is only applied to logsheet data

3
Why audit data ? Good Data = Good Decisions To make sure a decision or a strategy is right, the first thing to do is to make sure the data are representative – Is it correct ? – Is it complete ? Usage of logsheet data at member country level – Level of exploitation by national fleet – Level of exploitation in your EEZ – Decisions on National Fisheries Management – National reports based on fisheries data Usage of logsheet data at regional level – Level of exploitation in the region – Trends in Catch, Effort and CPUE – Stock assessments Need to audit the data to make sure decisions and strategies are not based on biased information

4
Ramifications of unrepresentative data … Examples… Under-estimating your domestic fleet catch… – Will not benefit in allocation issues … – Potential problems with input data to Regional and National assessments Under-estimating foreign fleet catch in your EEZ… – Will not benefit from fees related to catch in zone Not identifying misreported catches on the logsheets… – Will not benefit from fees related to catch in zone – Potential problems with input data to Regional and national assessments

5
Objectives of Data Audit To ensure that data are standardized – Almost guaranteed by the use of TUFMAN system to enter data – Basic checks on the database to make sure it is used properly To improve the quality and coverage of data available at national level and to the WCPFC – Data quality audit is applied to position/time, catch and effort – Coverage audit tries to identify missing logsheets – Both use extensively the VMS data and samples of paper logsheets To improve data collection in country – Existence of data registration system – Timeliness and frequency of provision of logsheet data from companies – Level of liaison/cooperation with fishing companies to retrieve logsheets – Existence of a filing system to easily retrieve hard-copy or scanned logsheets

6
In-Country Data Audit Process CompletenessAccuracy 1. Run the VMS reconciliation report 2. Communicate missing logsheet list to the fishing companies 3. Reception and entry of logsheets into TUFMAN 4. Evaluation of completeness in audit report 1. Manual check of a sample of logsheets 1. Run Data Quality Tests 2. Modification of obvious errors into TUFMAN 3. Use audit geographic system for warnings TUFMAN 3. Check logsheet flow from reception to archiving 4. Modification of warnings into TUFMAN 5. Evaluation of accuracy in audit report Presentation of audit report and conclusion Presentation of audit process

7
In-Country Visit One week visit – Usually data audit takes 4 days – 5 th days is spent on discussion, and other SPC task in-country (upgrading tools like SLOPS, upgrading Tufman system, troubleshooting problems) Fully funded by the SciCOFish project List of country to be visited in 2013 – Tuvalu / Kiribati / Solomon Islands / FSM / Fiji / Palau
 Fully funded by the SciCOFish project List of country to be visited in 2013 – Tuvalu / Kiribati / Solomon Islands / FSM / Fiji / Palau")
8
The Data Quality Audit Tool Stand-alone application to be linked to your Tufman database Comes with a set of tests separated in three categories : – Position/Time The tests will verify the accuracy of logsheets times and positions E.g. Average speed between sets, Missing sets, Overlapping trips, etc – Catch The tests will verify the accuracy of the catch part of logsheets E.g. By Catch – Effort The tests will verify the accuracy of the effort part of logsheets Discrepancies in number of hooks Generates pre-formatted Excel reports with test status and list of warning and error database entries Comes with an embedded GIS option in order to visualize any trip on the map The list of tests is not static and new ones can be easily added throughout the audit process Some basic automated correction could be also applied on demand

9
Example : The average speed between sets

10
Example of a test: Use of limits The speed limits for a longliner in the tool are set as follows : – Raise a warning if the speed is above 11 kts – Raise an error if the speed is above 15 kts

11
Example : The average speed between sets

12
Example of a test: The detail part 324 knots is obviously wrong The error is on the longitude entered for Feb 7 th – 01733E is wrong, it should be something around 173E (this points ends up in Namibia, Africa) – Need to get back to the paper logsheet and see what was the right value
 – Need to get back to the paper logsheet and see what was the right value")
13
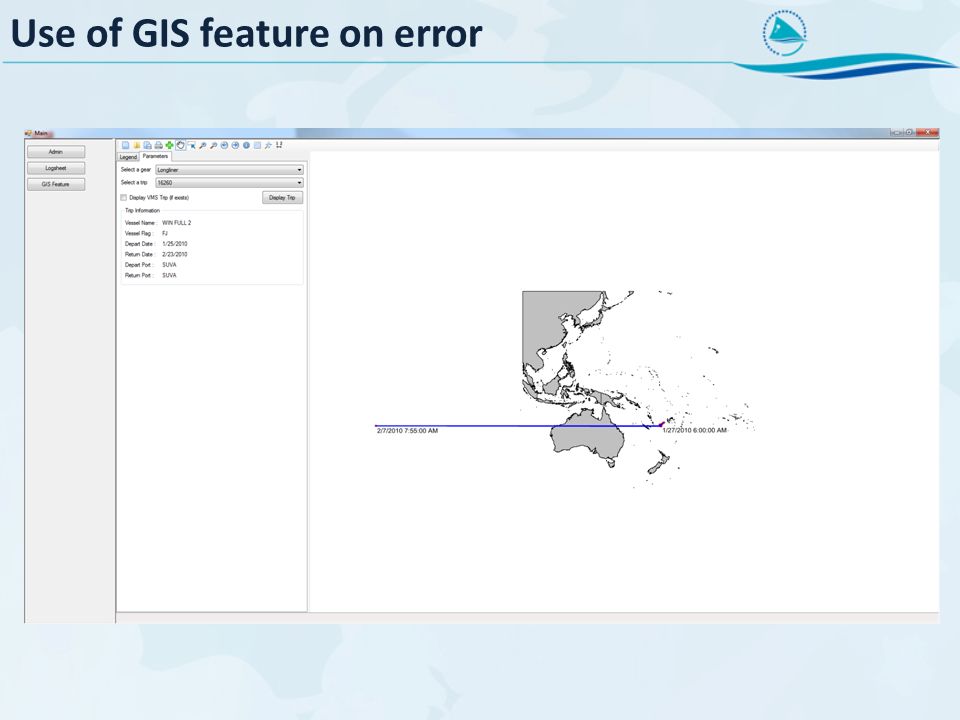
Use of GIS feature on error This trip error is obvious It is not always the case, and viewing the trip itself can help finding some answers Let’s take a look at this example

14
Use of GIS feature on error

16
Use of GIS feature on warning Previous example was from the error report. Let’s take one from the warning report (much less obvious) The SOLANDER 6 has been steaming at 11-12 knots between 3 positions, it is above the warning threshold Here the use of the GIS feature can help to ensure there is a position error on the logsheet
 The SOLANDER 6 has been steaming at knots between 3 positions, it is above the warning threshold Here the use of the GIS feature can help to ensure there is a position error on the logsheet.")
17
Use of GIS feature on warning

18
Use of GIS feature with VMS In order to help the decision to modify or not a point, the VMS reconciliation can be used (when applicable) This process is explained in details next on this presentation Its main purpose is to compare the logsheets with the trips generated from VMS and find reconciliations
 This process is explained in details next on this presentation Its main purpose is to compare the logsheets with the trips generated from VMS and find reconciliations")
19
Use of GIS feature with VMS

20
Data Collection Audit During in-country visit, the following aspect of data management will be checked – Data Registration E.g any potential hard-copy logsheet going missing prior to data entry or submission to regional agency – Hard-copy data management E.g does the responsibility matrix for hard-copy data management cover all work and match actual responsibilities – Database System E.g Are there any database post data-entry checking TUFMAN logsheets will be checked against randomly selected hard-copy logsheets

21
In-Country Data Audit Output The output of an audit consists in – The audit conclusion containing the audit results For each part of the audit (quality, coverage and data collection), the detailed status : FAILED, WARNING or SUCCESS The global audit status The summing up of the actions to be undertaken – The details of quality audit For each quality test (average speed between sets, inland positions, etc) The warnings and errors to be modified in Tufman – The detail of data collection Comments about each logsheet manually checked Comments about how to improve data collection – The detail of logsheet coverages per year, gear and flag To be generated in Tufman using the new report
, the detailed status : FAILED, WARNING or SUCCESS The global audit status The summing up of the actions to be undertaken – The details of quality audit For each quality test (average speed between sets, inland positions, etc) The warnings and errors to be modified in Tufman – The detail of data collection Comments about each logsheet manually checked Comments about how to improve data collection – The detail of logsheet coverages per year, gear and flag To be generated in Tufman using the new report")
22
Systemic Data Audit Tufman Reconciliation report is analysed during in-country visit The same tool is used internally at SPC to compare the same VMS data with the logsheets sent by the member countries to SPC Every quarter, an export will be sent to countries to highlight gaps in the logsheets received at SPC Two main reasons for a gap – Data received in-country from fishing company but not sent to SPC – Data not received in-country from fishing company

23
Future Online Audit Tool Following reconciliation example, data audit tool will be pushed to the cloud – It will be part of eRECAP – It will use your Tufman backup sent to SPC – It will provide you quality status data on your Tufman system In-Country visit will still be indispensable – To focus on key issues highlighted by the online audit – To audit logsheet management, which cannot be done online

24
Questions? Remarks?

Similar presentations


 Major Feature Description.>")


