Download presentation
Presentation is loading. Please wait.

1
6 th Grade Third Quarter Review: Standards 6.9, 6.10, 6.12, 6.13, 6.15, and 6.20

2
6.9

6
6.10b

7
B

8
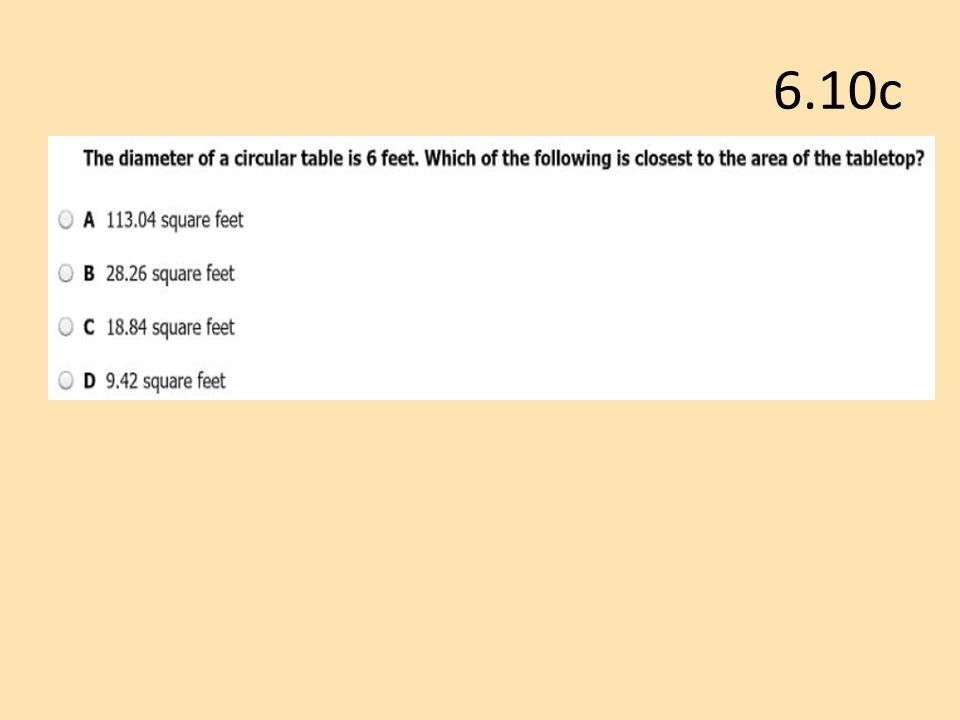
6.10c

9
A

10
6.10a

12
6.10b

14
6.10d

15
A

16
6.10b Clinton purchased a circular rug to cover part of a floor. The diameter of the rug is 8 feet. Rounded to the nearest whole number, what area of the floor will the rug cover? 16

18
6.10b A circular pool has a radius of 12 feet. What is the approximate distance around the pool, rounded to the nearest foot?

20
6.10 Dana has a rectangular garden that she wishes to fence in. If the dimensions of the garden are 15 feet by 13 feet, what is the minimum amount of fencing that she needs to enclose her garden?

22
Leo is designing a circular table top with a diameter of 10 feet. Which is closest to the circumference of this table top? a)314.2 feet b)78.5 square feet c) 31.4 feet d) 15.7 square feet 6.10b 22
314.2 feet b)78.5 square feet c) 31.4 feet d) 15.7 square feet 6.10b 22.")
23
c) 31.4 feet
 31.4 feet")
24
6.10d

26
Leo is designing a circular table top with a diameter of 10 feet. Which is closest to the area of this table top? a)314.2 feet b)78.5 square feet c) 31.4 feet d) 15.7 square feet 6.10b 26
314.2 feet b)78.5 square feet c) 31.4 feet d) 15.7 square feet 6.10b 26.")
27
b) 78.5 square feet
 78.5 square feet")
28
This triangle represents a section of a garden. (Figure is not drawn to scale.) What are the area of the garden? 6.10c 5 m 4 m 3 m 13 m 13.3 m 28
 What are the area of the garden. 6.10c 5 m 4 m 3 m 13 m 13.3 m 28.")
29
Area = 25.5 m²

30
6.10c-28

32
6.10c

35
B

36
6.10b

37
C

38
This triangle represents a section of a garden. (Figure is not drawn to scale.) What are the perimter of the garden? 6.10c 5 m 4 m 3 m 13 m 13.3 m 38
 What are the perimter of the garden. 6.10c 5 m 4 m 3 m 13 m 13.3 m 38.")
39
Perimeter = 35.3 m

40
A circular plate has a diameter of 11 inches. Which is closest to the area of this plate? A 17.3 square inches B 34.6 square inches C 95.0 square inches D 380.1 square inches 40 6.10b

41
C 95.0 square inches

42
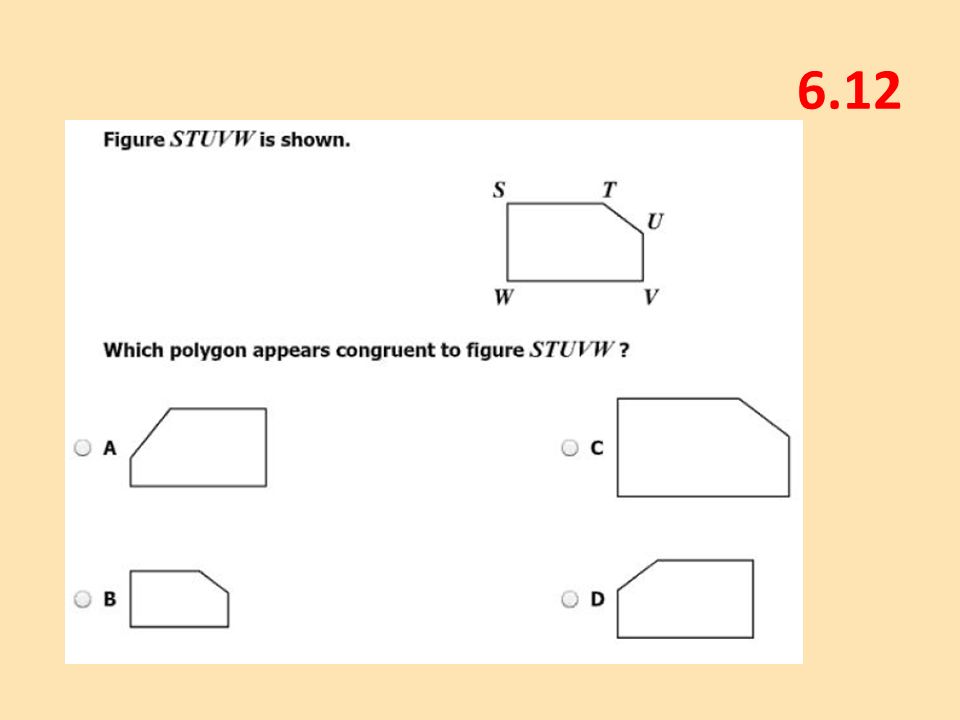
6.12

45
D

46
6.13

48
Name each figure using the given attributes with its most precise name. 1 23 456 Each angle is 90 ° 48

49
square trapezoid rhombus rectangle kite parallelogram 1 23 456 Each angle is 90 °

50
6.13 What term most accurately classifies all of these figures? 1 23 456 Each angle is 90 ° 50

51
quadrilateral

52
6.13 What term most accurately classifies figures 1, 3, 4, and 6? 1 23 456 Each angle is 90 ° 52

53
parallelogram

54
6.13 What term most accurately classifies figures 1 and 3? 1 23 456 Each angle is 90 ° 54

55
rhombus

56
Create a list of angle measures that could represent the four angle measures of a quadrilateral.,,, 56 6.13

57
Answer: Any four angle measures that sum 360 degrees

58
6.13 Which classifications appear to describe this figure? Parallelogram Trapezoid Quadrilateral Square Rhombus Rectangle 58

59
Parallelogram Trapezoid Quadrilateral Square Rhombus Rectangle 59

60
6.13 Which classifications describe this figure? Parallelogram Trapezoid Quadrilateral Square Rhombus Rectangle 60

61
Parallelogram Trapezoid Quadrilateral Square Rhombus Rectangle 61

62
Which classifications must describe the figure shown? A square and parallelogram B trapezoid and parallelogram C square and quadrilateral D trapezoid and quadrilateral 62 6.13

63
D trapezoid and quadrilateral

64
7.7 Select each property that is true for any rhombus. There is exactly one pair of parallel sides. There are exactly two pairs of parallel sides. There are exactly four congruent sides. There are exactly four right angles. There are exactly two pairs of congruent opposite angles. There are exactly four congruent angles. 64

65
There is exactly one pair of parallel sides. There are exactly two pairs of parallel sides. There are exactly four congruent sides. There are exactly four right angles. There are exactly two pairs of congruent opposite angles. There are exactly four congruent angles. 65

66
7.7 Select each figure that appears to be a rectangle. All angles in this figure are 90 degrees. All angles in this figure are 90 degrees. 66

67
All angles in this figure are 90 degrees. All angles in this figure are 90 degrees. 67

68
6.15 This line plot shows the number of books that a group of students have read. Use this data to determine where on the line plot the mean will appear. 68

69
x 69

70
6.15

72
This data shows the ages of members of a youth book club and the age of the facilitator. 11 12 13 14 15 16 1757 What is the most appropriate measure of center for this data? 72

73
Sample answer: Median because the age of the facilitator is much higher than the ages of the other members, and there is no mode. 73

74
6.15a Jill recorded the number of pull-ups each of ten students did on this line plot. What is the balance point for this data? 1 2 3 4 5 6 7 8 9 Pull-Ups Each X represents 1 student. Number of Pull-Ups X X X X X X XX X X 74

75
The balance point for this data is 5.

76
6.15a

77
A

78
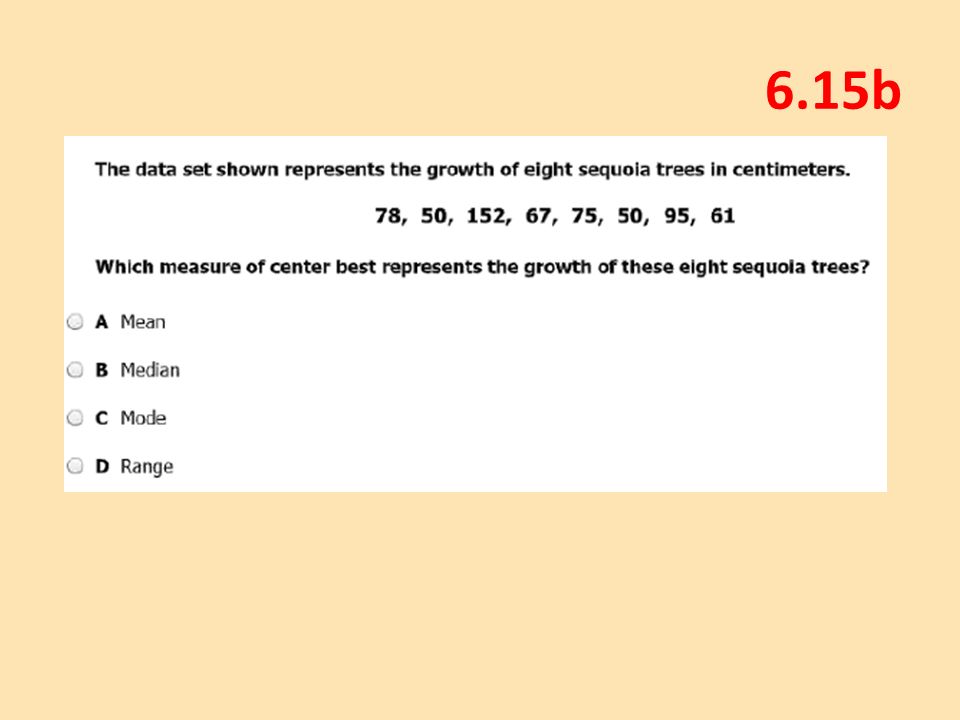
A) mean because all of the values are close to one another in value B) median because all of the values are close to one another in value C) mean because 240 is much higher than the other numbers in the data set D) median because 240 is much higher than the other numbers in the data set 78 6.15b The number of cookies that were made at a bakery for each of seven days is shown: 108, 96, 96, 84, 108, 240, and 84 The best measure of center for this data set is the-
 mean because all of the values are close to one another in value B) median because all of the values are close to one another in value C) mean because 240 is much higher than the other numbers in the data set D) median because 240 is much higher than the other numbers in the data set b The number of cookies that were made at a bakery for each of seven days is shown: 108, 96, 96, 84, 108, 240, and 84 The best measure of center for this data set is the-")
79
D) median because 240 is much higher than the other numbers in the data set
 median because 240 is much higher than the other numbers in the data set")
80
6.15b

81
D

84
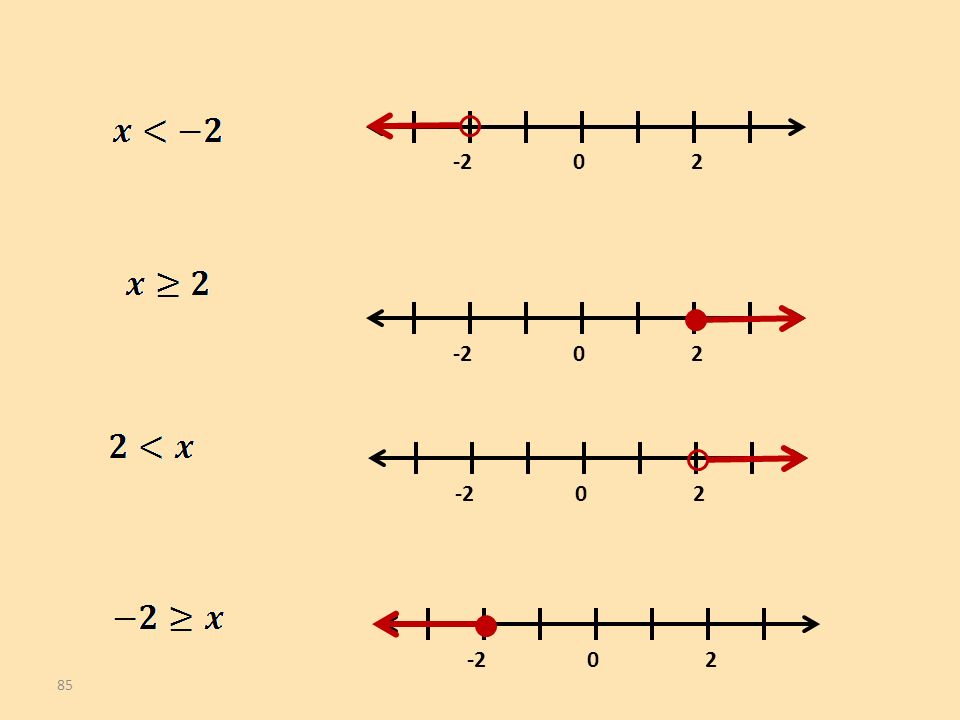
6.20 Match each inequality to the correct graph. 0 2 -2 0 2 0 2 0 2 84

85
0 2 -2 0 2 0 2 0 2 85
86
Which graph best represents the inequality ? a. b. c. d. 86 6.20

87
c. 87

88
6.20

89
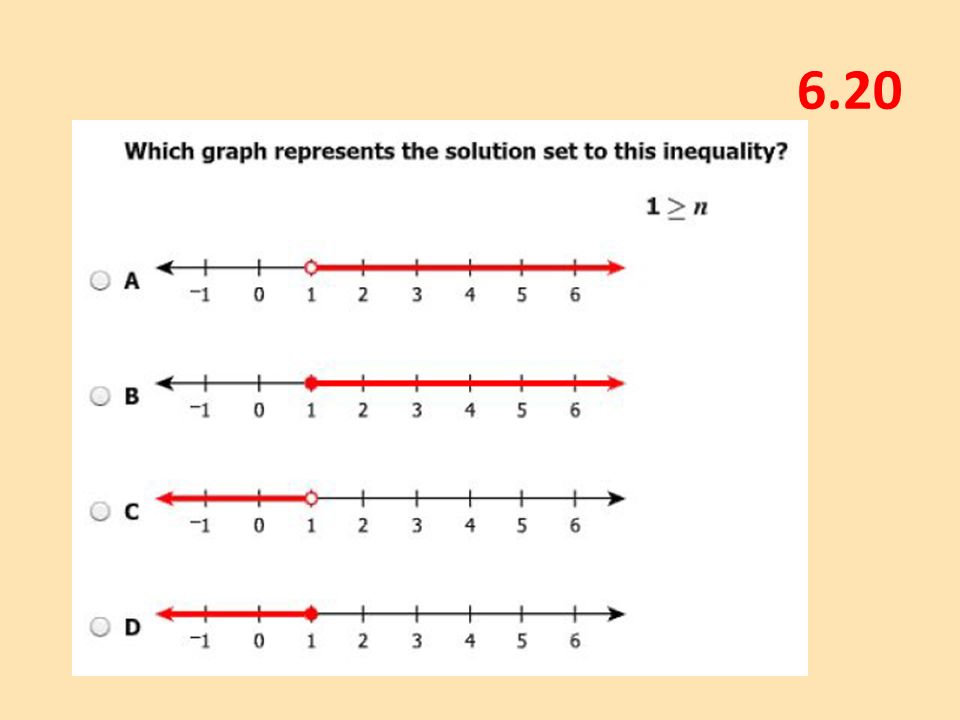
B

91
D

Similar presentations


 Geometry and spatial reasoning. The student compares and classifies shapes and solids using geometric vocabulary and properties. The student is expected.>")


