Download presentation
Presentation is loading. Please wait.

1
IT523-01N: DATA WAREHOUSING AND DATA MINING FINAL PROJECT INSTRUCTOR: DR. SHEILA FOURNIER- BONILLA ELEISHA BARNETT How Mpgs are Affected in Vehicles: A Model Using WEKA Supervised and Unsupervised Analysis Tools

2
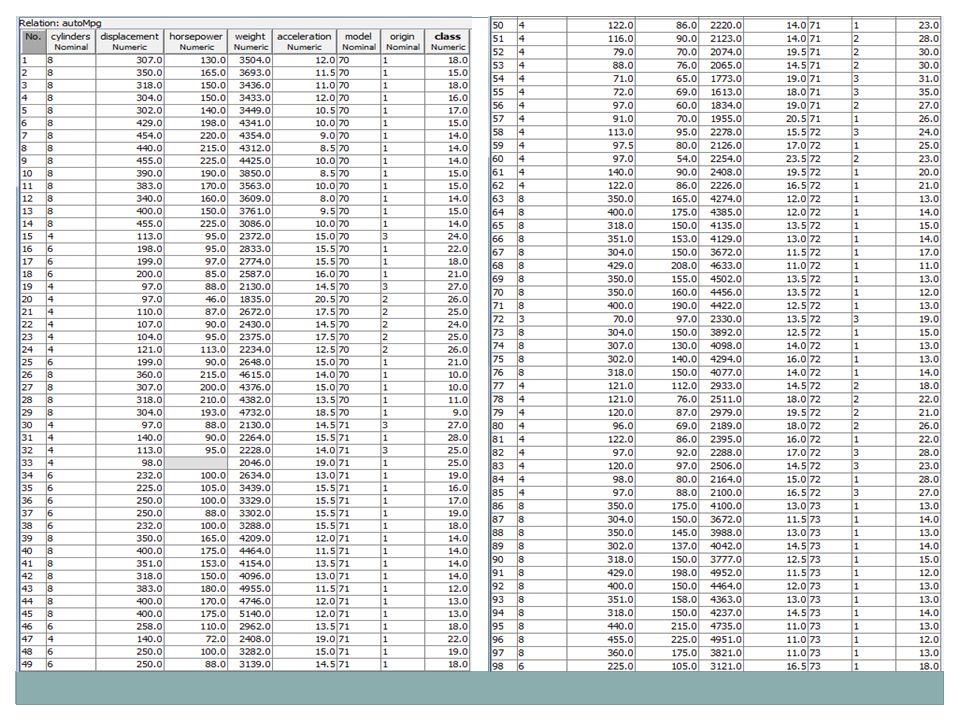
THE MODEL: A DATASET OF 398 AUTOMOBILES WITH 8 ATTRIBUTES THAT COULD POSSIBLY AFFECT A VEHICLE’S GAS CONSUMPTION (MILES PER GALLON) PERFORMANCE How Mpgs are Affected in Vehicles
 PERFORMANCE How Mpgs are Affected in Vehicles")
3
1908 Model T Ford? 1961 Chevrolet Corvette? Which Gets Better Gas Mileage?

4
The Attributes Number of Cylinders Engine Displacement Horsepower Weight Acceleration Model (model year) Origin (where the car was made) Class (luxury, sports, sedan, coupe, etc.)
 Origin (where the car was made) Class (luxury, sports, sedan, coupe, etc.)")
5
PART Analysis I first used the WEKA Data Analyzer doing a PART rule classification of all 398 instances with cylinders as the output attribute as many car manufacturers use cylinders as an indicator of power and gas mileage, generally meaning the smaller amount of cylinders, the better the gas mileage, but the less power, especially in terms of horsepower. Horsepower is a term whose original meaning is somewhat archaic, indicating the number of horses it would take to put out the same amount of power as found in an engine.

6
PART Analysis The PART Rule generator used engine displacement to generate the rules with the cylinders. This is important because engine displacement plays a part in the determination of gas mileage. To explain this further, Engine displacement is the volume swept by all the pistons inside the cylinders of an internal combustion engine in a single movement from top dead center to bottom dead center. It is commonly specified in cubic centimeters(cc), liters (l), or (mainly in North America) cubic inches (CID). Engine displacement does not include the total volume of the combustion chamber (Wikipedia, 2011).
, liters (l), or (mainly in North America) cubic inches (CID). Engine displacement does not include the total volume of the combustion chamber (Wikipedia, 2011)..")
7
PART Analysis As you can see, 6 rules were generated based on the given attributes and output. What we are given is generally, the greater the displacement, the more cylinders a vehicle has and also, the higher the gas consumption. For example, the vehicles with a rule of displacement > 70:4 (191.0/3.0) indicate a smaller engine, therefore less horsepower and a higher mpg or miles per gallon rating. Conversely, displacement > 258:8 (104.0/1.0) indicate a larger engine, more horsepower, and lesser mpg.
 indicate a smaller engine, therefore less horsepower and a higher mpg or miles per gallon rating. Conversely, displacement > 258:8 (104.0/1.0) indicate a larger engine, more horsepower, and lesser mpg..")
8
PART Analysis The number of correctly classified instances shows at 384/398 showing an accuracy rate of 96.4824%, 14 incorrectly classified at an accuracy rate of 3.5176%. It’s possible that the inaccuracies came from the odd European cars that have 3 and 5 cylinders and thus do not fit the usual profiles. This actually applies to 3 cylinders as there were not representations of 5 cylinders. The 3 cylinders were represented in 2 rules of origin = 1:4 (15.0/1.0) and displacement > 107:3 (4.0/1.0). The interesting item to note is that these 3 cylinders engines have the same displacement as a smaller 6 (displacement > 107:6(6.0/1.0) cylinder and presumably the same mpg rating.
 and displacement > 107:3 (4.0/1.0). The interesting item to note is that these 3 cylinders engines have the same displacement as a smaller 6 (displacement > 107:6(6.0/1.0) cylinder and presumably the same mpg rating..")
9
J48 Decision Tree Analysis As we can see by this J48 decision tree, the analysis breaks down the dataset further to show how origin of a vehicle might influence mpgs, however, the data indicates that there is little merit to this, but we will examine this further in the clusters analysis. In the meantime, the J48 bears out the same analysis as PART but breaks the analysis down further. In J48 analysis, it presents a slightly more accurate picture than PART.

10
J48 Analysis In this case, 386 (96.9849%) instances are correctly classified and only 12 (3.0151%) instances incorrectly classified. This sets our TRUE Positive rate at 1 versus a FALSE Positive rate of o.003, which means that we can be 100% confident in the correlation of the data in the rule of IF displacement 156 AND cylinder <= 6 THEN low mpg. The TP and FP rate is calculated based on the confusion matrix. We take the two classifications, add them together to get the predictive number and then divide the true positive number by the predictive number.

11
Cluster Analysis In cluster analysis, we must decide if there are associations and if they are worth further study. In this case, we use a rough measure of attribute significance to accomplish this. Specifically, for each attribute, subtract the attribute means for the two clusters and divide the absolute value of this result by the domain standard deviation for the attribute. Computations near or greater than one indicate attributes that have been clearly differentiated by the clustering. If there are no such attributes, the clustering is of little interest.

12
Cluster Analysis As we can see by the next slide, the differentials of the different attributes did not show at or near 1 and so we must conclude that this cluster analysis is not worth exploring. However, as we see in the final analysis, it may be a faulty line of reasoning.

13
CYLINDER AS THE OUTPUT ATTRIBUTE DISPLACEMENT = 241.249-193.4259/104.2698 = 0.46 HORSEPOWER = 118.181-104.4694/38.1992 = 0.36 WEIGHT = 3342.1622-2970.4246/846.8418 = 0.44 ACCELERATION = 15.0564-15.5681/2.7577 = 0.19 CLASS = 20.0135-23.5146/7.816 = -0.45 Cluster Analysis

14
Linear Regression Analysis In our final analysis, we will be looking at linear regression. The purpose of regression analysis is to come up with an equation of a line that fits through that cluster of points with the minimal amount of deviations from the line. The deviation of the points from the line is called "error." Once I have this regression equation, I could use this information to predict class. Simple linear regression is actually the same as a bivariate correlation between the independent and dependent variable (Princeton, 2011).
..")
15
Linear Regression Analysis I can use linear regression to predict values of one variable, given values of another variable. If I plot the values on a graph, with cylinder on the x axis and displacement on the y axis, for example, then the result is a linear relationship between cylinder and displacement showing a cluster of points on the graph which slopes upward.

16
Linear Regression Analysis However, some very interesting results presented here. While the cylinder/displacement relationship bore true, following the slope upward, it indicates that there are other factors in determining mpg. The clusters grow stronger through horsepower, weight, and acceleration, weakening in model year and origin, and becoming strong again in class.

21
Linear Regression Analysis Due to incompatibility issues with the WEKA autompg.arff file and Excel, I was unable to copy and paste into Excel and run a LINEST analysis which is why I ran the WEKA visualization. However, I was able to snip and paste the data onto this presentation so as to give one the instances and attributes used.

22
WHAT CAN WE CONCLUDE FROM THESE ANALYSES? ENGINE SIZE DOES PLAY A ROLE IN GASOLINE CONSUMPTION HOWEVER, OTHER ATTRIBUTES NEED TO BE CONSIDERED IN DETERMINING GAS MILEAGE OR MPG. THESE ATTRIBUTES INCLUDE WEIGHT, ACCELERATION, HORSEPOWER, AND CLASS OF VEHICLE IT IS PRUDENT TO USE MORE THAN ONE ANALYSIS TOOL WHILE NEITHER THE MODEL T NOR THE CORVETTE SHOWN IN SLIDE 3 WERE PART OF THE DATASET, THE MODEL T WINS AT 25 MPG VERSUS THE CORVETTE AT 8 MPG Conclusion

23
THE FORD MODEL T USED A 177 CUBIC INCH (2.9 L) INLINE 4 CYLINDER ENGINE. IT WAS PRIMARILY A GASOLINE ENGINE, BUT IT HAD MULTIFUEL ABILITY AND COULD ALSO BURN KEROSENE OR ETHANOL. IT PRODUCED 20 HP FOR A TOP SPEED OF 45 MPH. THE CHEVROLET CORVETTE USED A 327 CU IN (5.36 L) V8 8 CYLINDER ENGINE AND WAS STRICTLY A GAS ENGINE. IT PRODUCED 340 HP FOR A TOP SPEED OF 130 MPH Conclusion
 V8 8 CYLINDER ENGINE AND WAS STRICTLY A GAS ENGINE. IT PRODUCED 340 HP FOR A TOP SPEED OF 130 MPH Conclusion.")
24
References http://en.wikipedia.org/wiki/Engine_displacement accessed 29 May 11 http://en.wikipedia.org/wiki/Engine_displacement Roiger, R. J.; Geatz, M. W., Data Mining (2003). A Tutorial-Based Primer, Addison Wesley, Boston, MA Marakas, G. M. (2003). Modern data warehousing, mining, and visualization: core concepts. Upper Saddle River, NJ: Prentice Hall The University of Waikato (WEKA) http://www.cs.waikato.ac.nz/ml/weka/http://www.cs.waikato.ac.nz/ml/weka/ http://tunedit.org/search?q=arff accessed 27 May 11 http://tunedit.org/search?q=arff Barnett, Eleisha (2011) Photos courtesy of Eleisha Barnett http://en.wikipedia.org/wiki/Chevrolet_Corvette accessed 30 May 11 http://en.wikipedia.org/wiki/Chevrolet_Corvette http://en.wikipedia.org/wiki/Ford_Model_T_engine accessed 30 May 11 http://en.wikipedia.org/wiki/Ford_Model_T_engine
. A Tutorial-Based Primer, Addison Wesley, Boston, MA Marakas, G. M. (2003). Modern data warehousing, mining, and visualization: core concepts. Upper Saddle River, NJ: Prentice Hall The University of Waikato (WEKA) q=arff accessed 27 May 11 q=arff Barnett, Eleisha (2011) Photos courtesy of Eleisha Barnett accessed 30 May accessed 30 May 11")
Similar presentations


 Inferences from.>")


