Download presentation
Presentation is loading. Please wait.

1
Genomics and Bioinformatics

2
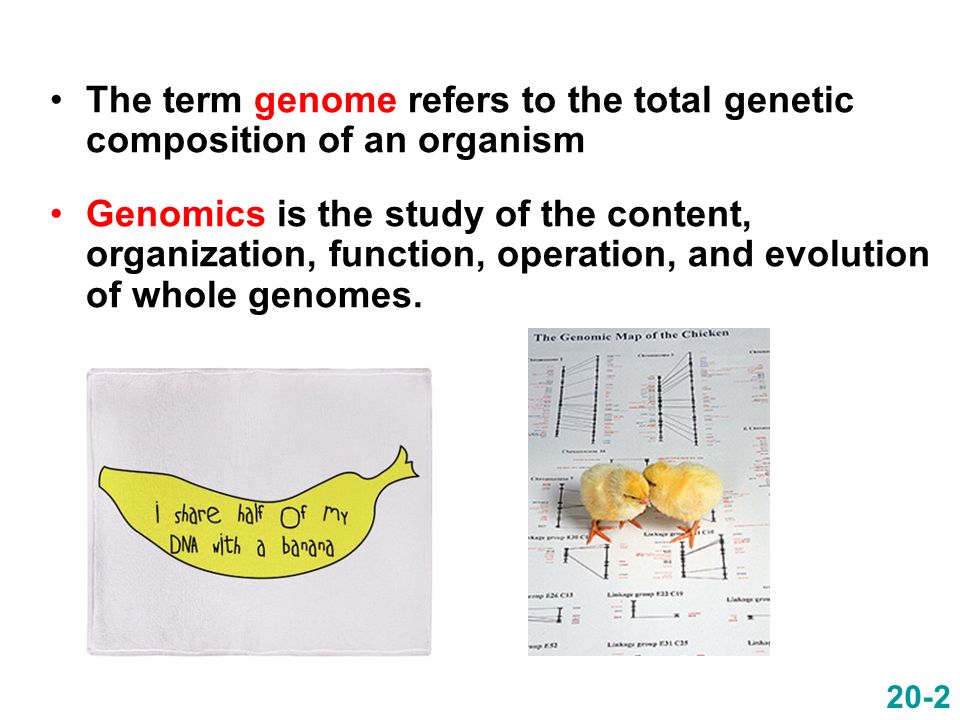
The term genome refers to the total genetic composition of an organism Genomics is the study of the content, organization, function, operation, and evolution of whole genomes. 20-2
3
20-3 Copyright ©The McGraw-Hill Companies, Inc. Permission required for reproduction or display Figure 20.1 A complete map of the genome of the bacterium Haemophilus influenzae 1.83 million bp ~ 1,743 genes In 1995, researchers led by Craig Venter and Hamilton Smith obtained the first complete DNA sequence of an organism: The bacterium Haemophilus influenzae

4
In 1996, the genome of the first eukaryote was completed by a worldwide consortium led by Andre Goffeau in Belgium –Saccharomyces cerevisiae (baker’s yeast) –The genome contains 16 linear chromosomes ~ 12 million bp containing ~ 6,200 genes Structural genomics begins with the mapping of the genome and progresses ultimately to its complete sequencing Functional genomics examines how the interactions of genes produces the traits of an organism Proteomics is the study of all the proteins encoded by the genome and their interactions Copyright ©The McGraw-Hill Companies, Inc. Permission required for reproduction or display 20-4

5
What is the relationship between genome size and gene number? In prokaryotes, the gene number is proportional to the genome size because most of the genome encodes proteins. Eukaryotic genomes are typically much larger due to the increased amount of noncoding DNA (introns, transposable elements). Eukaryotes typically encode more genes and the genomes are larger.
. Eukaryotes typically encode more genes and the genomes are larger..")
6
Genomic content can vary widely among related species. There appears to be little relationship between the complexity of an organism, the number of genes or amount of DNA.

7
There are three common ways to determine the organization of DNA regions on a chromosome –1. Cytogenetic mapping Also called cytological mapping –2. Linkage mapping –3. Physical mapping Copyright ©The McGraw-Hill Companies, Inc. Permission required for reproduction or display 20-5

8
20-7 Copyright ©The McGraw-Hill Companies, Inc. Permission required for reproduction or display Figure 20.2 Note: Correlations between the three maps often vary from species to species and from one region of the chromosome to another Three types of maps for two genes in Drosophila melanogaster sc scute, an abnormality in bristle formation w white eye

9
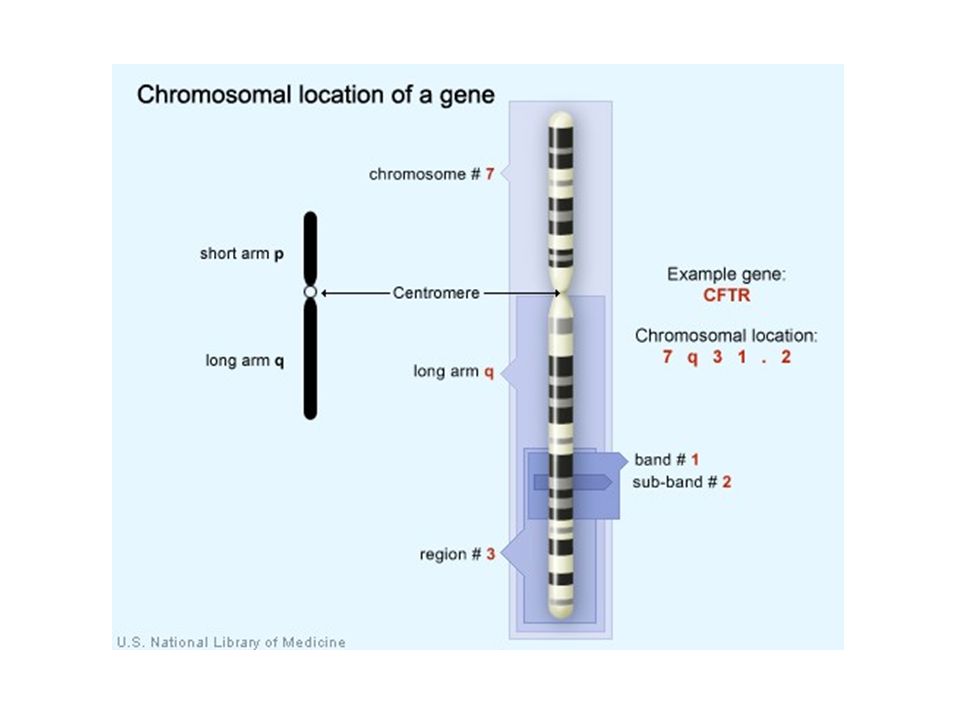
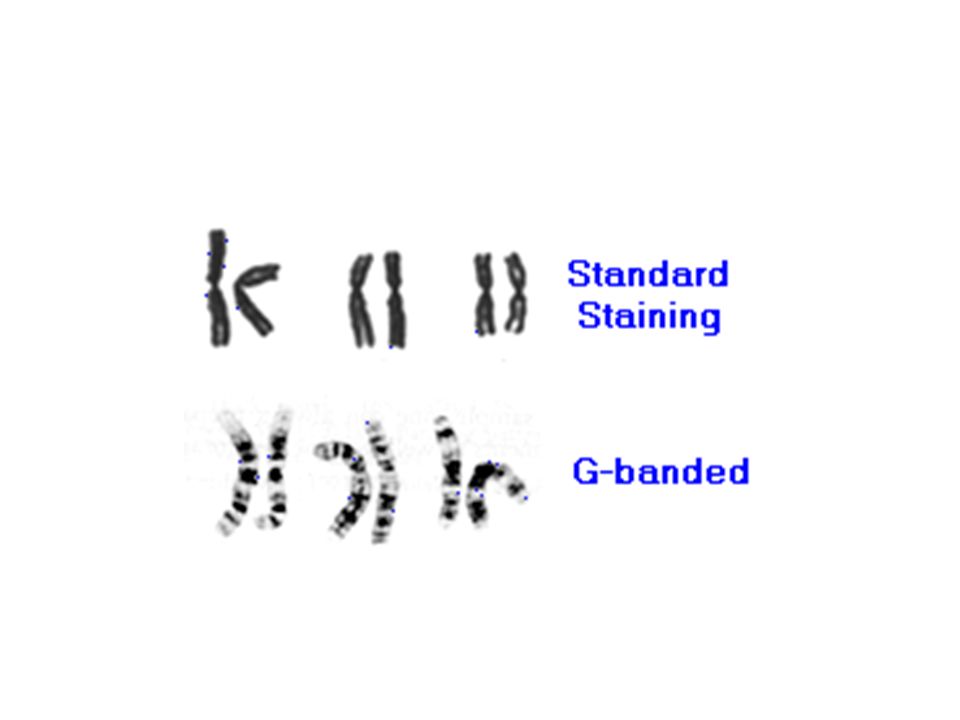
Cytogenetic mapping relies on microscopy –Therefore, it has a fairly crude limit of resolution –It is commonly used with eukaryotes which have much larger chromosomes Eukaryotic chromosomes can be distinguished by –Size –Centromeric locations –Banding patterns Copyright ©The McGraw-Hill Companies, Inc. Permission required for reproduction or display Cytogenetic Mapping 20-8

10
Chromosomes are treated with particular dyes –The banding pattern that results is used for mapping Cytogenetic mapping tries to determine the location of a particular gene relative to a banding pattern –It is often used as a first step in the localization of genes in plants and animals Copyright ©The McGraw-Hill Companies, Inc. Permission required for reproduction or display 20-9

12
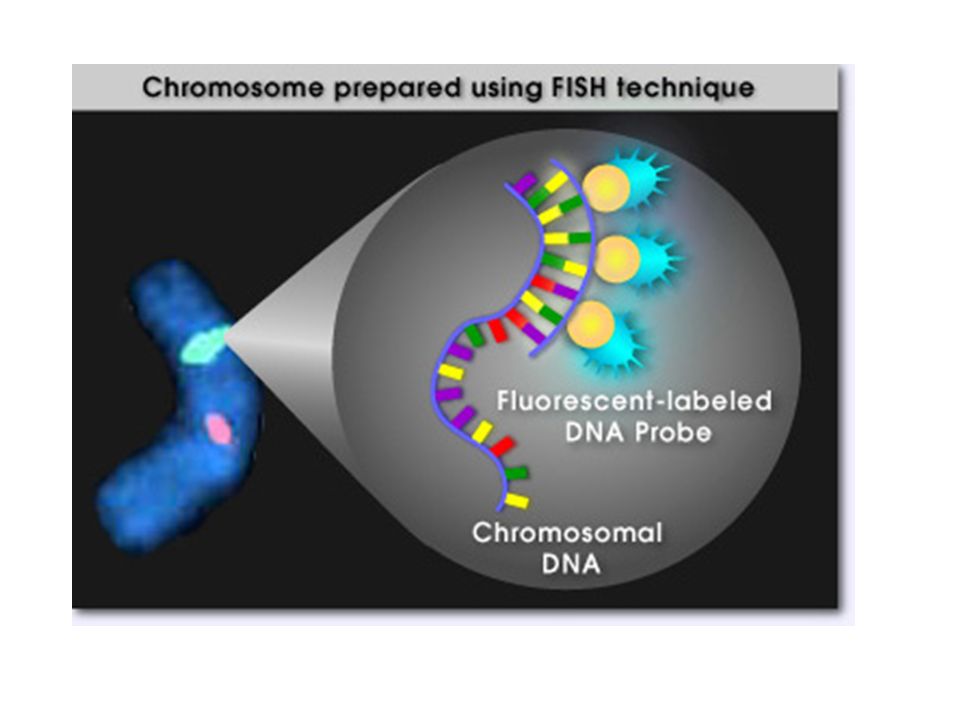
In situ hybridization can locate the position of a gene at a particular site within an intact (in situ) chromosome –It is used to map the locations of genes or other DNA sequences within large eukaryotic chromosomes Researchers use a probe to detect the “target” DNA The most common method uses fluorescently labeled DNA probes –This is referred to as fluorescence in situ hybridization (FISH) In situ Hybridization 20-10
 chromosome –It is used to map the locations of genes or other DNA sequences within large eukaryotic chromosomes Researchers use a probe to detect the target DNA The most common method uses fluorescently labeled DNA probes –This is referred to as fluorescence in situ hybridization (FISH) In situ Hybridization 20-10")
14
20-11 Figure 20.3 The technique of fluorescence in situ hybridization (FISH) Cells are treated with agents that make them swell and are then fixed on slides DNA probe has been chemically modified to allow the fluorescent label to bind to it https://highered.mheducation.com/sites/983409 2339/student_view0/chapter18/fish.html
 Cells are treated with agents that make them swell and are then fixed on slides DNA probe has been chemically modified to allow the fluorescent label to bind to it /student_view0/chapter18/fish.html")
15
To detect the light emitted by a fluorescent probe, a fluorescence microscope is used –The fluorescent probe will be seen as a colorfully glowing region against a nonglowing background Remember that the probe will only bind a specific sequence The results of the FISH experiment are then compared to Giemsa-stained chromosomes –Thus, the location of a probe can be mapped relative to the G banding pattern 20-12

17
This illustrates the results of a FISH experiment involving six different probes.

18
FISH testing is applied to cells in amniotic fluid, obtained from a pregnant woman carrying a baby suspected of having Down syndrome (trisomy 21). Three copies of chromosome 21 are observed (red signals). The green signals (two copies) are for chromosome 13; these are for control purposes and show that the test is working properly,
. The green signals (two copies) are for chromosome 13; these are for control purposes and show that the test is working properly,.")
19
Linkage mapping relies on the frequency of recombinant offspring to map genes –Geneticists have realized that regions of DNA, which need not encode genes, can be used as genetic markers Linkage Mapping with Genetic Markers 20-13

20
genetic markers A molecular genetic marker is a DNA segment that is found at a specific site and can be uniquely recognized –As with alleles, the characteristics of molecular markers may vary from individual to individual Therefore, the distance between linked molecular markers can be determined from the outcome of crosses

21
Types of Molecular Markers RFLP AFLP Minisatellites (VNTR) Microsatellites SNPs STS
 Microsatellites SNPs STS")
22
Restriction enzymes recognize specific DNA sequences and cleave the DNA at those sequences Along a very long chromosome, a particular restriction enzyme will recognize many sites –These are randomly distributed along the chromosome –When comparing two individuals, a given restriction enzyme may produce certain fragments that differ in length Restriction Fragment Length Polymorphisms (RFLPs) 20-15 https://highered.mheducation.com/sites/9834092339/ student_view0/chapter18/restriction_fragment_length _polymorphisms.html
 student_view0/chapter18/restriction_fragment_length _polymorphisms.html")
23
20-16 Figure 20.5 Restriction fragment length polymorphisms (RFLPs) Restriction site only found in individual 1 Thus, there is a polymorphism in the population with regard to the length of a particular DNA fragment Arrows indicate sites cut by a restriction enzyme This variation can arise as a result of deletions, duplications, mutations, etc.
 Restriction site only found in individual 1 Thus, there is a polymorphism in the population with regard to the length of a particular DNA fragment Arrows indicate sites cut by a restriction enzyme This variation can arise as a result of deletions, duplications, mutations, etc.")
24
Figure 20.6 An RFLP analysis of chromosomal DNA from three different individuals EcoRI sites PRESENT on both chromosomes 20-17 EcoRI sites ABSENT from both chromosomes

25
20-18 EcoRI site found only on one chromosome The three individuals share many DNA fragments that are identical in size Indeed, if these segments are found in 99% of individuals in the population, they are termed monomorphic Polymorphic bands are indicated at the arrows

26
In actual RFLP analysis, DNA samples containing all chromosomal DNA would be isolated –EcoRI digestion would yield so many fragments that the results would be very difficult to analyze To circumvent this problem, Southern Blotting is used to identify RFLPs Copyright ©The McGraw-Hill Companies, Inc. Permission required for reproduction or display 20-19

27
Figure 20.7 Southern blot hybridization of a specific RFLP 20-20 Same three individuals as those of Figure 20.6 RFLPs are always inherited in a codominant manner A heterozygote (individual 3) will have two bands of different lengths A homozygote (individuals 1 and 2) will display only one band Copyright ©The McGraw-Hill Companies, Inc. Permission required for reproduction or display

29
We can map the distance between two RFLPs by making crosses and analyzing the offspring –However, we look at bands on a gel rather than phenotypic characteristics Copyright ©The McGraw-Hill Companies, Inc. Permission required for reproduction or display The Distance Between Two Linked RFLPs Can Be Determined 20-21

30
Figure 20.8 20-22

31
Figure 20.8 20-23 If the RFLPs are not linked, a 1:1:1:1 ratio of all four types would be expected in the offspring If the RFLPs were linked, a higher percentage of parentals would be expected (due to independent assortment) In fact, there are more parental offspring Therefore the RFLPs are linked
 In fact, there are more parental offspring Therefore the RFLPs are linked")
32
RFLP linkage analysis can be conducted on many different RFLPs to determine their relative locations in the genome A genetic map composed of many RFLP markers is called an RFLP map –RFLP maps are used to locate genes along particular chromosomes Figure 20.9 shows a simplified RFLP map of the five chromosomes of the plant Arabidopsis thaliana Copyright ©The McGraw-Hill Companies, Inc. Permission required for reproduction or display RFLP Maps 20-25

33
Figure 20.9 20-26 The left side describes the locations of RFLP markers The right side describes the map distances in map units Copyright ©The McGraw-Hill Companies, Inc. Permission required for reproduction or display A few known genes are shown in red

34
In 1978, Yuet Kan and Andree Dozy confirmed that RFLP markers can be used to predict heterozygosity –Their experiment focused on the -globin gene The normal allele (Hb A ) results in the formation of hemoglobin A The mutant allele (Hb S ) results in the formation of hemoglobin S Copyright ©The McGraw-Hill Companies, Inc. Permission required for reproduction or display RFLP Analysis and Disease-Causing Alleles 20-27

35
Using restriction fragment analysis to distinguish the normal and sickle-cell alleles of the -globin gene Normal -globin allele Sickle-cell mutant -globin allele 175 bp 201 bpLarge fragment DdeI Ddel 376 bp Large fragment DdeI restriction sites in normal and sickle-cell alleles of -globin gene. Electrophoresis of restriction fragments from normal and sickle-cell alleles. Normal allele Sickle-cell allele Large fragment 201 bp 175 bp 376 bp (a) (b) In this case the actual disease causing mutation also mutates a restriction site -globin coding sequence used as probe
 (b) In this case the actual disease causing mutation also mutates a restriction site -globin coding sequence used as probe.")
36
The assumption is that a disease-causing allele had its origin in a single individual, known as a founder –The founder lived many generations ago –Since that time the allele has spread throughout the human population Copyright ©The McGraw-Hill Companies, Inc. Permission required for reproduction or display 20-28

37
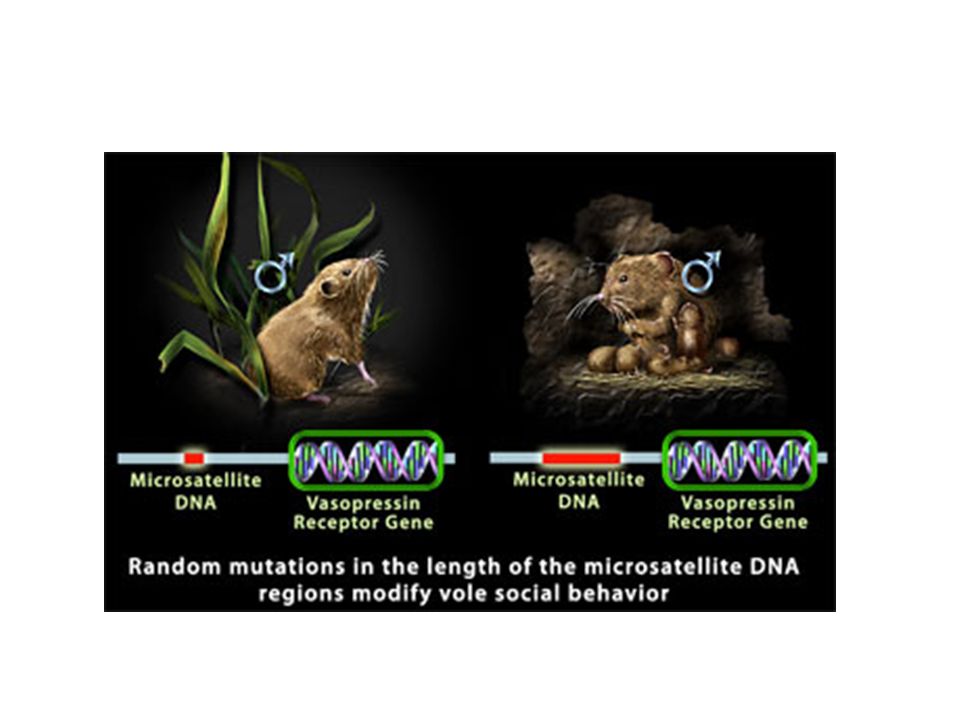
Microsatellites –Short, simple sequences (2-5 base pairs DNA) –Abundantly dispersed throughout a species’ genome –Variable in length among different individuals The most common human microsatellite is the sequence (CA) n, where n may range from 5 to more than 50 –(CA) n is found about every 10,000 bases in the genome Copyright ©The McGraw-Hill Companies, Inc. Permission required for reproduction or display Genetic Mapping Using Microsatellites 20-34

38
20-35 Figure 20.11 Identifying a microsatellite using PCR primers Add PCR primers The PCR primers specifically recognize sequences on chromosome 2 Copyright ©The McGraw-Hill Companies, Inc. Permission required for reproduction or display The amplified region is called a sequence-tagged site (STS) The two STS copies in this case are different in length Therefore, their microsatellites have different numbers of CA repeats
 The two STS copies in this case are different in length Therefore, their microsatellites have different numbers of CA repeats.")
39
Stylized examples of microsatellite data. Data were produced by gel electrophoresis.

40
These data were produced by analysis on an automated capillary electrophoresis-based DNA sequencer (ABI 3130xl). The data are line graphs with the location of each peak on the X-axis representing a different sized PCR product and the color of each peak indicates the alleles of microsatellite.

41
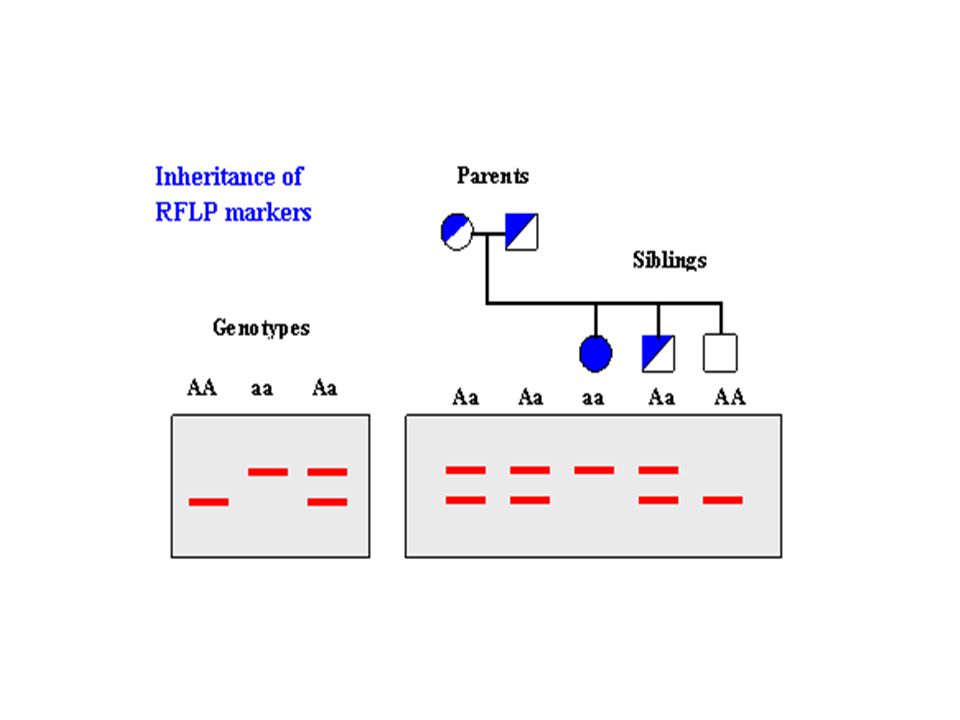
The inheritance pattern of microsatellites can be studied –Indeed, PCR amplification of particular microsatellites provides an important strategy for analysis of pedigrees This idea is shown in Figure 20.12 –Prior to this analysis, a unique segment of DNA containing a microsatellite has been identified –PCR amplification (Figure 20.11) provides a mechanism to test for this microsatellite in a family of five Copyright ©The McGraw-Hill Companies, Inc. Permission required for reproduction or display 20-36

43
20-37 Figure 20.12 Identifying pattern of microsatellites in a human pedigree Copyright ©The McGraw-Hill Companies, Inc. Permission required for reproduction or display

44
A key difference between RFLPs and microsatellites –RFLPs use restriction enzymes and Southern blots Rather difficult –Microsatellites use PCR Relatively easy A newer kind of molecular marker combines the above two approaches –The markers are termed amplified restriction fragment length polymorphisms (AFLPs) –To identify AFLPs, chromosomal DNA is digested with one to two restriction enzymes Specific fragments are then amplified via PCR 20-38
 –To identify AFLPs, chromosomal DNA is digested with one to two restriction enzymes Specific fragments are then amplified via PCR 20-38")
45
Making AFLPS Amplified Fragment Length PolymorphismS

46
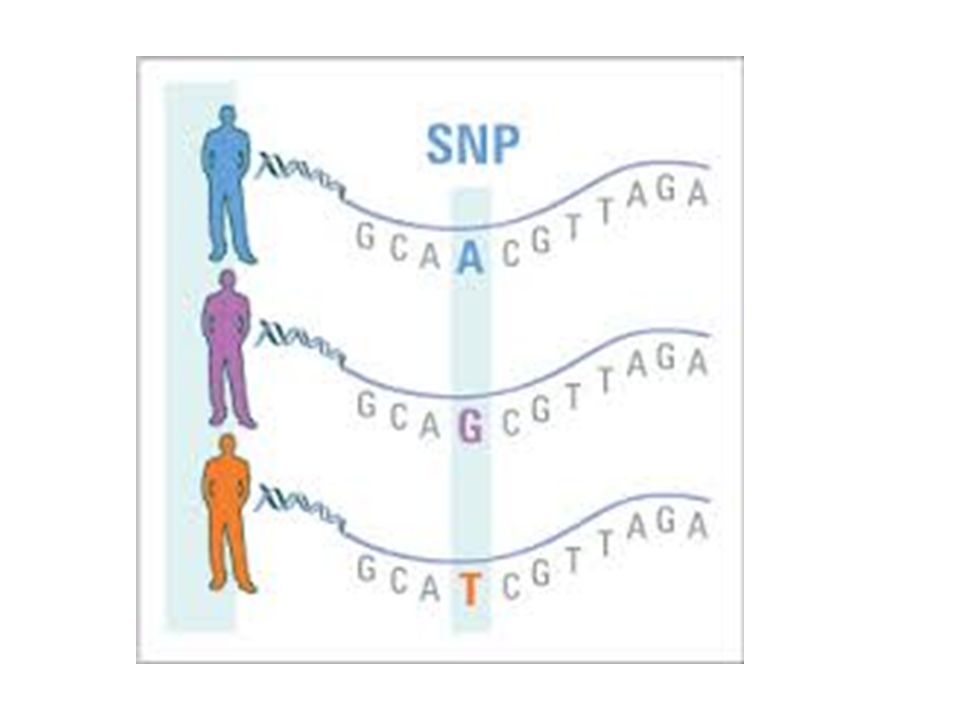
SNP’s Single Nucleotide Polymorphisms A single base change arising through mutation Some do not produce a phenotypic difference Can be used to diagnose disease

48
Haplotypes A specific set of SNP’s and other genetic variants located on a chromosome SNP’s within a haplotype tend to be linked and inherited together Crossing-over can occur and give indication of distance between the mutation genes.

49
SNP’s and Haplotypes

50
Genomewide Association Studies The use of numerous SNPs scattered across the genome to find genes of interest. Strong associations have been found genes and diseases such as Crohn disease, rehuematoid arthritis, bipolar disorder, hypertension, and diabetes.

51
EST Expressed Sequence Tags Used to identify protein-coding genes (less than 2% for humans). These are RNA markers associated with DNA sequences that are expressed as RNA. RNA is isolated from cell and subjected to reverse transcription to make cDNA. Short stretches from the end are sequenced to provide a marker.

52
A physical map locates genes or markers based on the physical length of DNA sequences. They have much greater accuracy and resolution, down to a single base pair. In recent years, physical mapping studies have led to the DNA sequencing of entire genomes PHYSICAL MAPPING 20-39

53
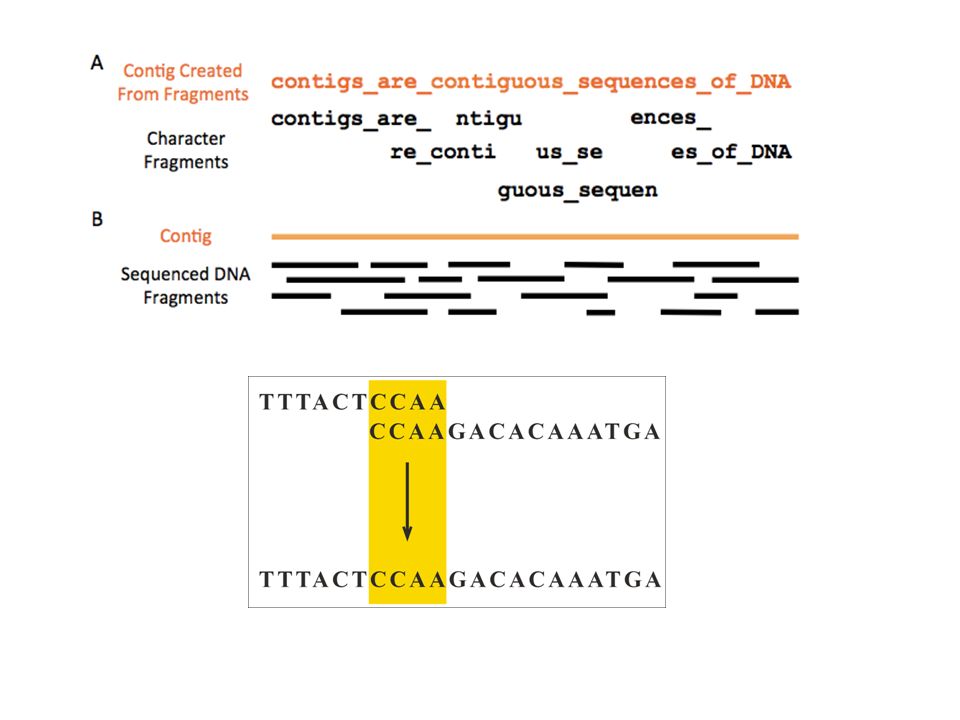
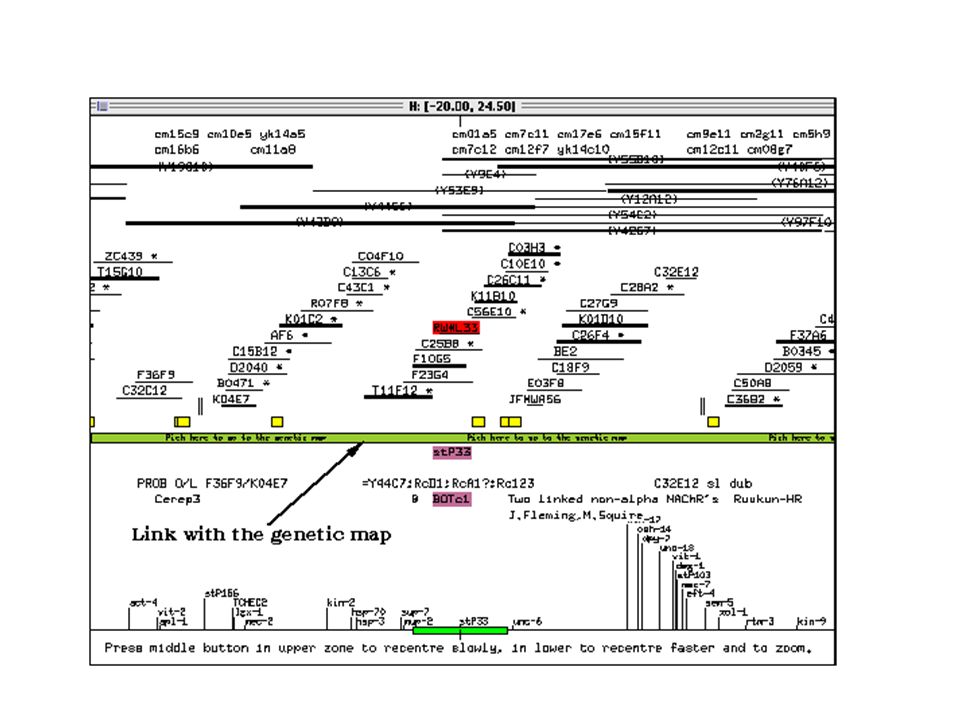
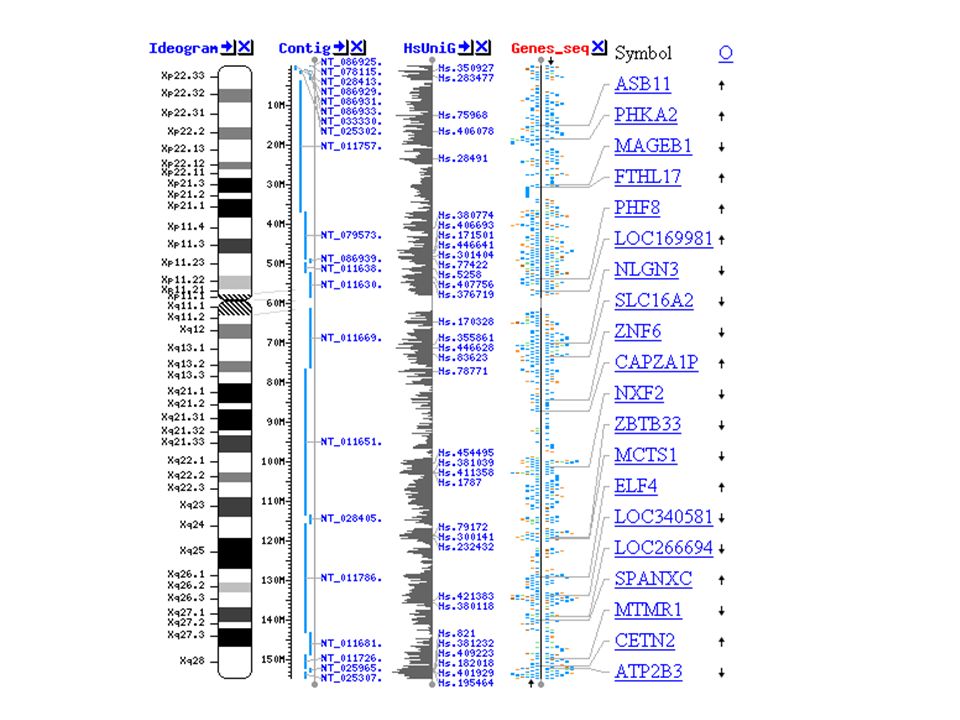
A common type of physical map is one that connects isolated pieces of genomic DNA that have been cloned in bacteria (BACs) or yeast (YACs). The overlapping YAC or BAC clones are assembled to form the completed map. Contig: Contiguous sequence of DNA created by assembling overlapping sequenced fragments of a chromosome. Computer programs are used to determine long fragments.

57
Figure 20.18 compares the cytogenic, linkage and physical maps of chromosome 16 –This is a very simplified map A more detailed map takes over 10 pages of your textbook to print!

58
Figure 20.18 20-51

59
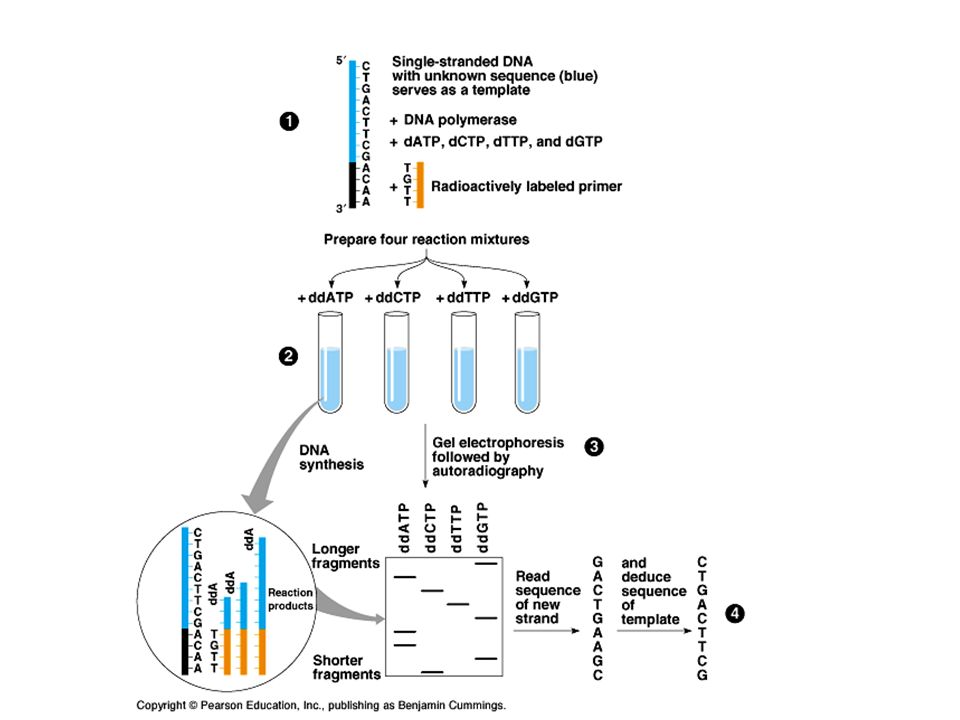
How can the DNA sequence of a fragment be determined Sanger Sequencing is a method of DNA sequencing based on the selective incorporation of chain-terminating dideoxynucleotides by DNA polymerase during in vitro DNA replication.DNA sequencingdideoxynucleotidesDNA polymerasein vitroDNA replication Developed by Frederick Sanger and colleagues in 1977, it was the most widely used sequencing method for approximately 25 years.Frederick Sanger This classical chain-termination method requires a single-stranded DNA template, a DNA primer, a DNA polymerase, normal deoxynucleotidetriphosphates (dNTPs), and modified di- deoxynucleotidetriphosphates (ddNTPs), the latter of which terminate DNA strand elongation.primerDNA polymerase
, and modified di- deoxynucleotidetriphosphates (ddNTPs), the latter of which terminate DNA strand elongation.primerDNA polymerase")
60
These chain-terminating nucleotides lack a 3'-OH group required for the formation of a phosphodiester bond between two nucleotides, causing DNA polymerase to cease extension of DNA when a modified ddNTP is incorporated.OHphosphodiester bond The ddNTPs may be radioactively or fluorescently labeled for detection in automated sequencing machines.fluorescently https://highered.mheducation.com/sites/9834092339/student_vi ew0/chapter18/sanger_sequencing.html

63
Biological studies that use computer programs, particularly in the fields of genetics and genomics. geneticsgenomics

64
Common uses of bioinformatics include the identification of candidate genes and nucleotides (SNPs) to better understand the genetic basis of disease, unique adaptations, desirable properties (esp. in agricultural species), or differences between populations.
, or differences between populations..")
65
A number of databases have been established for the collection and analysis of DNA

67
Metagenomics When bioinformatics is applied to a whole group of organisms such as the microbial populations in the human gut

68
Finding the gene Scans the sequence looking for features within the gene, such as start and stop codons, introns, promoters, etc. Or…comparative approach, comparing sequence to known genes to see if a similar gene BLAST is used for this purpose

69
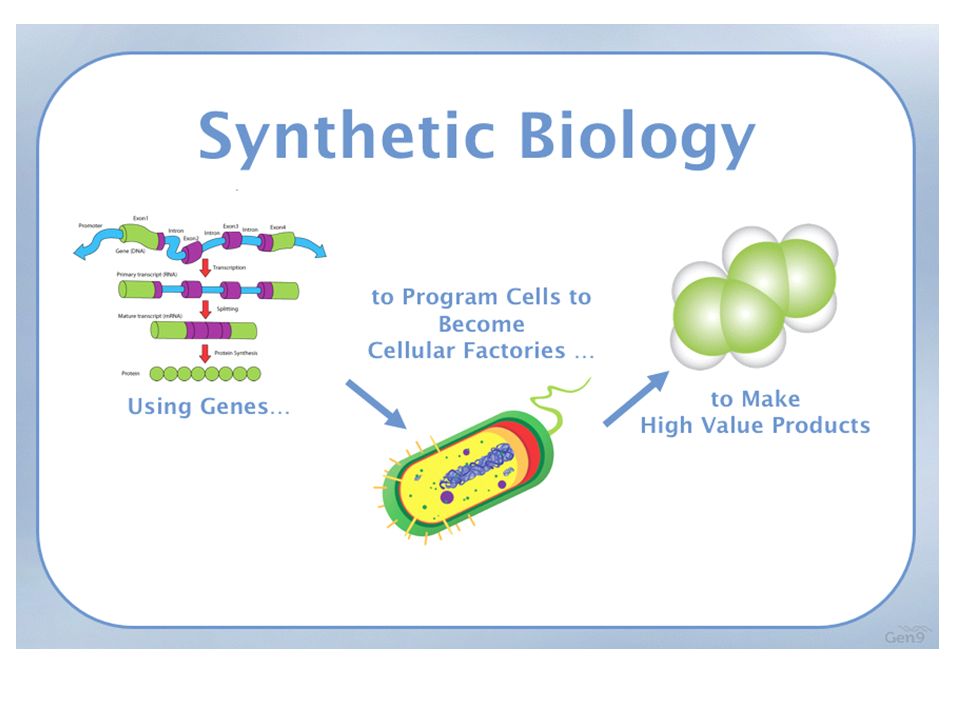
Synthetic Biology Designing organisms that might provide useful functions, such as microbes that provide clean energy or break down toxic wastes https://video.search.yahoo.com/video/play;_ylt=A2KLqICpDRpVpRsAQU QsnIlQ;_ylu=X3oDMTByN2RnbHFoBHNlYwNzcgRzbGsDdmlkBHZ0aW QDBGdwb3MDMw-- ?p=Daniel+Gibson+and+synthetic+biology&vid=ce5bd6da4a228a5ad539 37d3efbd8d54&l=4%3A02&turl=http%3A%2F%2Fts2.mm.bing.net%2Fth

71
Functional Genomics Characterizing functions of sequences Lab Techniques: in situ hybridization, experimental mutagenesis, transgenic animals and knockouts Also homology searches

73
Homology Searches The goal is to use computational methods to determine the function of genes rather than lab techniques Homology searches – comparison of DNA and protein sequences from the same organism and different organisms Homologous – genes that are evolutionarily related If function of related gene is known, then can be similar function

74
Gene Expression and Microarrays When and where genes are expressed The microarray consists of DNA probes fixed to a solid support, such as a nylon membrane or glass slide May contain ten of thousands of probes Useful in detecting which genes are expressed in cancer tissue Remember if genes are expressed, RNA is being produced.

76
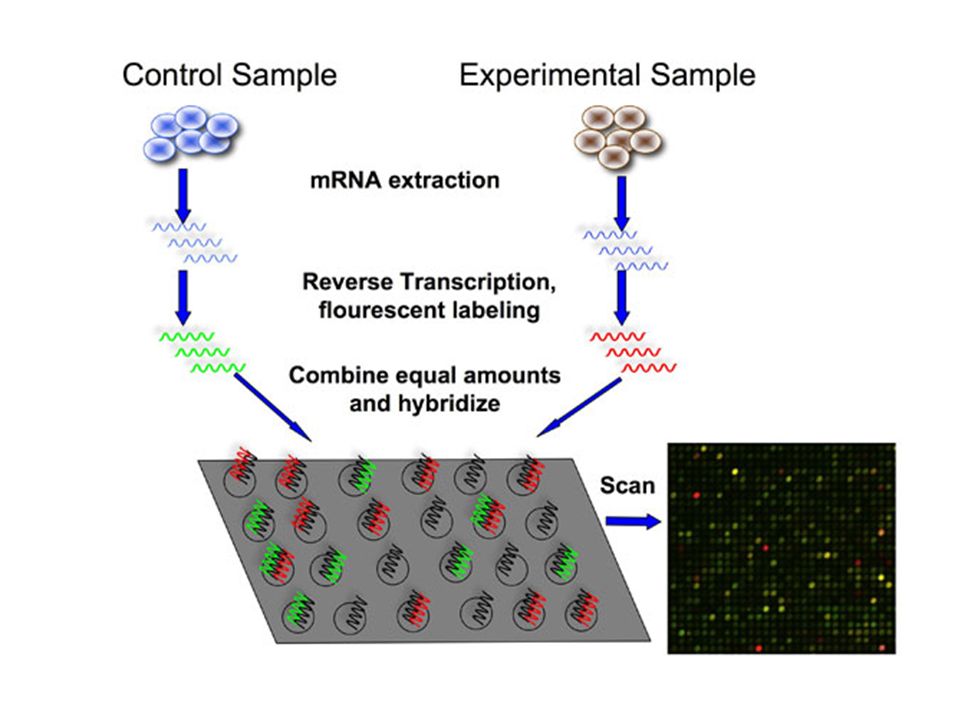
Steps

77
For example, typically a normal cell and experimental cell are compared for gene expression. The RNA is extracted, cDNA is made and fluorescently labeled (control green, experimental red) Combine equal amounts of each to microarray slide. If red: the disease gene is expressed. If green: the control gene is expressed. If yellow: gene expressed in both. If black: gene not expressed in either. Red – expression Green – underexpression Yellow – both No color – no expression Useful in detecting genes expressed in cancer
 Combine equal amounts of each to microarray slide. If red: the disease gene is expressed. If green: the control gene is expressed. If yellow: gene expressed in both. If black: gene not expressed in either. Red – expression Green – underexpression Yellow – both No color – no expression Useful in detecting genes expressed in cancer.")
78
Gene expression and reporter sequences Coding region is replaced with reporter sequence which codes for an easily observable trait such as GFP Can determine when gene would be turned on

79
Reporter GFP in embryoes

80
Comparative Genomics Studies how genomes evolve Compares similarities and differences in gene content, function, and organization among genomes of different organisms

81
Prokaryotes Most have between 1 million and 3 million bps of DNA and about 1000 to 2000 genes Density of genes is uniform, about one gene per 1000 bp No noncoding DNA Horizontal gene transfer (the movement of genes between different species) has been important in evolution of them.
 has been important in evolution of them.")
82
Eukaryotes Genomes larger and more variable No clear relation between complexity and amount of DNA or genes Much of genome consists of repetitive DNA Transposable elements are very common

83
Transposable Elements A transposable element (TE or transposon) is a DNA sequence that can change its position within the genome, sometimes creating or reversing mutations and altering the cell's genome size.DNA sequencegenome mutations genome size Transposition often results in duplication of the TE. Barbara McClintock's discovery of these jumping genes earned her a Nobel prize in 1983.Barbara McClintockNobel prize

84
45% of human DNA is from transposable elements, most is defective and unable to move anymore

85
In 1988, the NIH established an Office of Human Genome Research, with James Watson as director The human genome project officially began on October 1, 1990 and ended in 2003. –It has been the largest internationally coordinated undertaking in the history of biological research From the outset the goals of the human genome project are the following: Copyright ©The McGraw-Hill Companies, Inc. Permission required for reproduction or display 20-55 The Human Genome Project

86
1. To obtain a genetic linkage map of the human genome 2. To obtain a physical map of the human genome 3. To obtain the DNA sequence of the entire human genome 4. To develop technology for the management of human genome information 5. To analyze the genomes of other model organisms 6. To develop programs focused on understanding and addressing the ethical, legal, and social implications of the results obtained from the Human Genome Project 7. To develop technological advances in genetic methodologies Copyright ©The McGraw-Hill Companies, Inc. Permission required for reproduction or display 20-56

87
In just a couple of decades, our ability to map and sequence genomes has improved dramatically Motivation behind genome sequencing projects come from a variety of sources –1. Basic research Cloning and characterization of genes –2. Medicine Identification of genes that (when mutant) play a role in disease –3. Agriculture Development of new strains of organisms with improved traits 20-57 Many Genomes Have Been Sequenced
 play a role in disease –3. Agriculture Development of new strains of organisms with improved traits Many Genomes Have Been Sequenced.")
88
What did we find out?

89
The Human Genome 3.2 billion bps About 25% transcribed into RNA Less than 2% codes for protein Active genes are separated by vast regions of noncoding DNA usually from transposable elements About 24,000 genes

90
More facts….. Average gene is 27,000 bps The human genome does not encode substantially more protein domains but the domains are combined in more ways to produce a relatively diverse proteome. A single gene often codes multiple proteins due to alternative splicing of mRNA.

91
Alternative mRNA splicing

Similar presentations


 The order of the base pairs in the sequence of every human varies In a single.>")


. If the medium used for plating cells.>")

 Size rangeExample speciesEx. Size BACTERIA1-10 Mb E. coli: 4.639 Mb FUNGI10-40 Mb S. cerevisiae 13 Mb INSECTS.>")
