Download presentation
Presentation is loading. Please wait.

1
Trade Map A web-based trade flow analysis tool

2
Introduction An exporter of pineapples is looking to diversify its client base…Which country should be targeted? A shoe exporter needs an overview of trade barriers he/she would face for exports to Malaysia… A trade mission needs to know our top export products to Germany… Where could you import automotive components from? Who are the largest suppliers in your region? What is the current trade between your country and the United States? Initial answers to these questions and many more are easily found in Trade Map

3
Trade Map Online application to produce reports on international trade flows Every product (HS-6) to and from (almost) every country Based on probably the largest trade flow database in the world User-friendly interface, report-ready outputs Flexibility for customising reports, analysis Graphic presentation of outputs to facilitate analysis
 to and from (almost) every country Based on probably the largest trade flow database in the world User-friendly interface, report-ready outputs Flexibility for customising reports, analysis Graphic presentation of outputs to facilitate analysis")
4
Key characteristics Where does the data come from? National Authorities COMTRADE, produced by the United Nations Statistics Division database COMTRADE What is Trade Map’s geographical coverage? Information for over 220 countries and territories using data reported by 170 countries and territories (not all have reported each year) Data for non-reporting countries is derived from mirror statistics What is Trade Map’s product coverage? For the Harmonized System over 5,300 products at the 6 digit level For the National Tariff Line up to 30,000 products for 90 countries (~84% of world trade) What is Trade Map’s time horizon? Yearly, quarterly and monthly data
 Data for non-reporting countries is derived from mirror statistics What is Trade Map’s product coverage. For the Harmonized System over 5,300 products at the 6 digit level For the National Tariff Line up to 30,000 products for 90 countries (~84% of world trade) What is Trade Map’s time horizon. Yearly, quarterly and monthly data.")
5
Data classification The Harmonized System (HS) Is used as a basis for the collection of Custom duties and international trade statistics by almost all countries, representing about 98% of world trade Developed by the World Customs Organisation – WCO (www.wcoomd.org)www.wcoomd.org Implemented late 1980s. Harmonised different existing nomenclatures Adopted by almost all countries in the world Basis for all trade conversations internationally Main revisions in 1996, 2002 and 2007

6
HS-2 HS-4 HS-6 Data classification The Harmonized System (HS) Is a numerical classification system of products used as a basis for international trade statistics by almost all countries. is harmonized up to six digits (HS-6) - You can compare HS data between countries.HS-6 Is broken down into 3 clusters: HS-2: the chapter of the good (sector) E.g. 09 = Coffee, Tea, Mate and Spices HS-4: groupings within the chapter (sub-sector) E.g. 0902 = Tea, whether or not flavoured HS-6: product(s) within the grouping (product level) E.g. 090210 = Green tea (not fermented) More and more specific
 - You can compare HS data between countries.HS-6 Is broken down into 3 clusters: HS-2: the chapter of the good (sector) E.g. 09 = Coffee, Tea, Mate and Spices HS-4: groupings within the chapter (sub-sector) E.g = Tea, whether or not flavoured HS-6: product(s) within the grouping (product level) E.g = Green tea (not fermented) More and more specific.")
7
HS-2 HS-4 HS-6 NTL Data classification National Tariff Lines (NTL) codes Classification of goods after the 6 digit level of the Harmonized System classification. National Tariff Lines go from 8 digits to 12 digits. Why use the HS and NTL classification? The HS classification is standardised internationally The NTL classification is not standardised internationally. Each country decides its own further classification after the Harmonized System. Hence, National Tariff Line codes can be different from a country to another. More and more specific

8
Data classification Australia mangoes 08.04.50.00Fresh or dried guavas, mangoes and mangosteensJapan Mangoes 08.04.50.01.1Mangoes, fresh 08.04.50.01.9Guavas and mangosteens, fresh United States: Mangoes 08.04.50.40.40Mangoes, fresh, if entered during the period from September 1, in any year, to the following May 31, inclusive 08.04.50.60.80Guavas and mangosteens, fresh, if entered during the period from June 1 to August 31, of the following year, inclusive mangoes 08.04.50.80.00Guavas, mangoes and mangosteens, dried 08Edible fruit and nuts; peel of citrus fruit or melons. mangoes 08.04Dates, figs, pineapples, avocados, guavas, mangoes and mangosteens, fresh or dried. mangoes 08.04.50Guavas, mangoes and mangosteens. HS (Internationa l standard) NON NTL (NON standard)
 NON NTL (NON standard).")
9
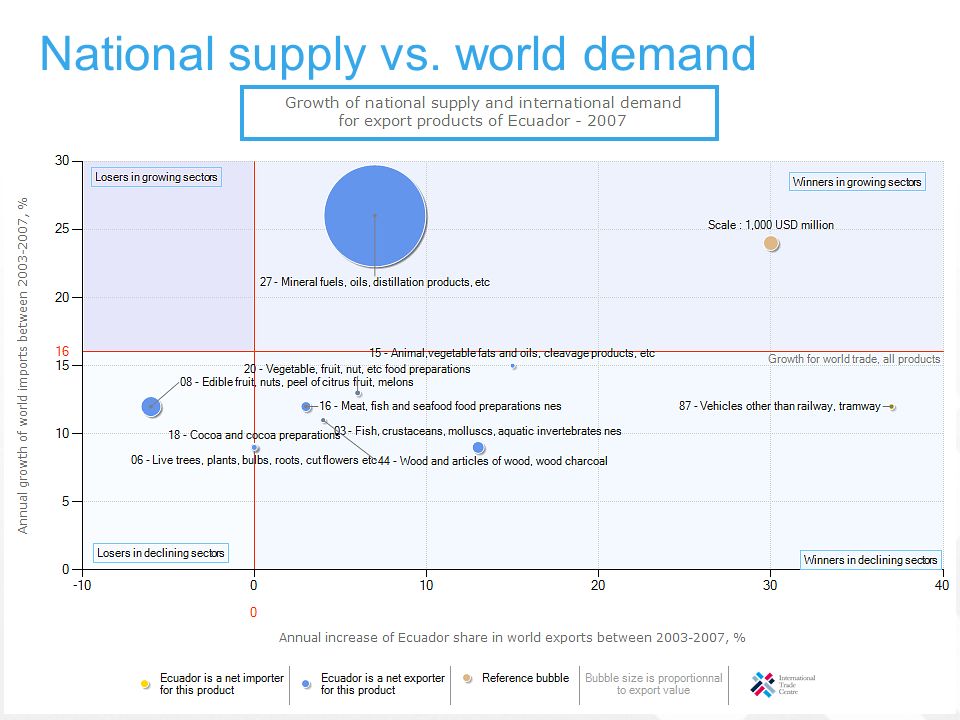
Bubble graphs in Trade Map Same logic applies, but adapted to specific needs: Instead of products, HS codes (2, 4, 6 digits) or countries. Adapted to each analytical need: National supply vs. international demand National supply vs. international demand growth Export performance relative to market demand Prospects for market diversification

10
Free to users from developing countries T hanks to financial contributions from ITC's Global Trust Fund and the World Bank, as of the 1st January 2008, all users from developing countries and territories may access ITC's market analysis tools free of charge. developing countries and territories http://www.intracen.org/marketanalysis

12
Free to users from developing countries

13
Trade Map selection menu

14
Direction of flow Country/Region selection Partner country selection Product selection Data visualisation

15
Advanced search Three options to search for product codes This is the option to use if you haven't found the product code for your product

16
Advanced search "Search by Hierarchy" allows you to display the entire HS system up to the HS6 level and to identify the specific description of each code

17
Managing groups Create your own product or country groups to suit your needs

18
Select product and/or market Two options: 1.Type in the product code 2.Type in first letters of keyword Then select code to analyse

19
Select product and/or market Bear in mind: No country/product selection means ALL countries/products selected Click here to get trade indicators that facilitate analysis

20
World demand for pineapples Always read title of the table first!!

21
World demand for pineapples Situation Trends Structure

22
World demand for pineapples Quantity unit, depends on type of good Countries Quantity imported in the last available year Value of imports, in thousands of US Dollars, in the last available year Trade balance= exports – imports Unit Value= Value/Quantity; provides an indication of average value of one unit of the product; NOT actual price of the product

23
World demand for pineapples Average annual growth of the imported value over the past 5 years Average annual growth of the imported quantity over the past 5 years Growth rate of the imported value over the past year

24
World demand for pineapples Share of world maket held by each country. Shows how concentrated the world supply is.

25
World demand for pineapples Chose a target market based on different criteria (size, dynamism, proximity, etc.)
")
26
Assess performance in market

27
Situation in target market Trends in target market Performance of partner countries

28
Assess performance in market Competitors in the target market

29
Assess performance in market Selecting National Tariff Line level...... automatically changes the output format to time series

30
Assess performance in market Alternatives for displaying data

31
Assess performance in market - NTL NTL codes under the HS6 code provide first glimpse at market segmentation and consumer preferences

32
Assess performance in market - NTL Competitors currently in this market Global competitors NOT present in this market

33
Analyse time series

34
Identify and understand seasonality through quarterly and/or monthly data

35
Analyse time series in graphic format Seasonality!

36
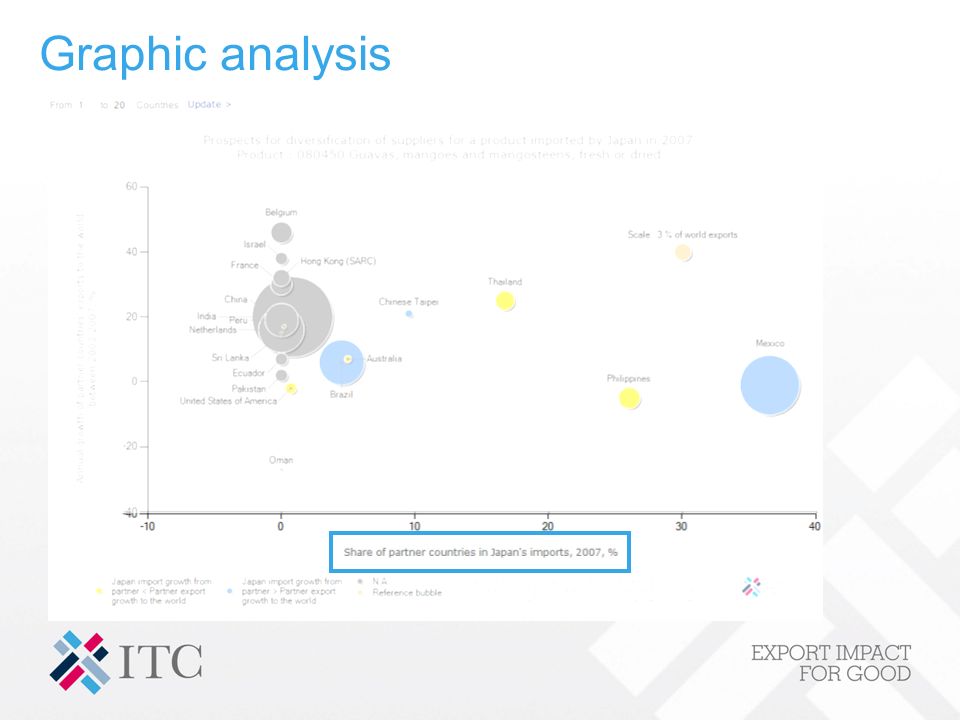
Graphic analysis

39
Japan gaining importance as a market for partner country Japan losing importance as a market for partner country

40
Graphic analysis Who are alternative suppliers that Japan could source from?

41
Analyse potential for bilateral trade Select your countries/regions

42
Initial approach at the HS-2 level Analyse potential for bilateral trade

43
Brazil's imports from Malaysia – Existing demand in Brazil for products coming from Malaysia

44
Analyse potential for bilateral trade Malaysia's exports to the world – Existing supply potential from Malaysia

45
Analyse potential for bilateral trade Malaysia's exports to the world – Countries currently importing Malaysia's products

46
Analyse potential for bilateral trade Brazil's imports from the world – existing demand in Brazil for products that could potentially be sourced from Malaysia

47
Analyse potential for bilateral trade Brazil's imports from the world – countries which Brazil is currently buying from

48
Analyse potential for bilateral trade Refine analysis at HS6 level

49
Analyse potential for bilateral trade Further refine analysis at NTL level – for base country only, obviously

50
Trade Map Graphs Bubble Charts: Positioning products according to growth rates and changes in market share

51
Babies Stars Dogs Cash cows High Market Growth Low Product Life Cycle Boston Consulting model or matrix Portfolio model of product selection based on stage in life cycle Low High Relative Market Share

52
Babies Stars Dogs Cash cows Boston Consulting model or matrix Farm-direct Organic coffee Specialty coffee Instant coffee High Market Growth Low High Relative Market Share Bubble size is proportional to sales of product

53
Bubble graphs in Trade Map Same logic applies, but adapted to specific needs: Instead of products, HS codes (2, 4, 6 digits) or countries. Adapted to each analytical need: National supply vs. international demand National supply vs. international demand growth Export performance relative to market demand Prospects for market diversification

54
National supply vs. world demand

56
Prospects for market diversification

57
Growth in demand for a local product

58
TradeMap helps users… Search for new markets or suppliers Assess competition or diversify sources Benchmark their trade performance Set priority products for trade promotion and development Evaluate tariffs and trade barriers Assess product diversification potential with a partner country

Similar presentations


 Maryam Bakht ECE dep. University of Tehran.>")