Download presentation
Presentation is loading. Please wait.

1
Unit 3: Aggregate Demand and Supply and Fiscal Policy 1

2
1.Identify the two types of tool boxes the government has to fix the economy 2.Explain and give examples of Expansionary Fiscal Policy 3.Explain and give examples of Contractionary Fiscal Policy 4.Explain the Multiplier Effect 5.Explain how to calculate the spending multiplier 6.Name 10 University Mascots Review 2

3
Price level Real GDP (billions) Review 1.What type of gap? 2.Contractionary or Expansionary needed? 3.What are two options to fix the gap? 4.How much initial government spending is needed to close gap? AD 2 AD 1 +$40 Billion Congress uses discretionary fiscal policy to the manipulate the following economy (MPC =.8) P1P1 $800 $1000FE AS LRAS 3
 P1P1 $800 $1000FE AS LRAS 3.")
4
Price level Real GDP (billions) Review AD 1 AD P2P2 $50FE $100 AS 1.What type of gap? 2.Contractionary or Expansionary needed? 3.What are two options to fix the gap? 4.How much government spending (decrease) is needed to close gap? LRAS Congress uses discretionary fiscal policy to the manipulate the following economy (MPC =.9) -$5 Billion 4
 is needed to close gap. LRAS Congress uses discretionary fiscal policy to the manipulate the following economy (MPC =.9) -$5 Billion 4.")
5
Problems With Fiscal Policy 5

6
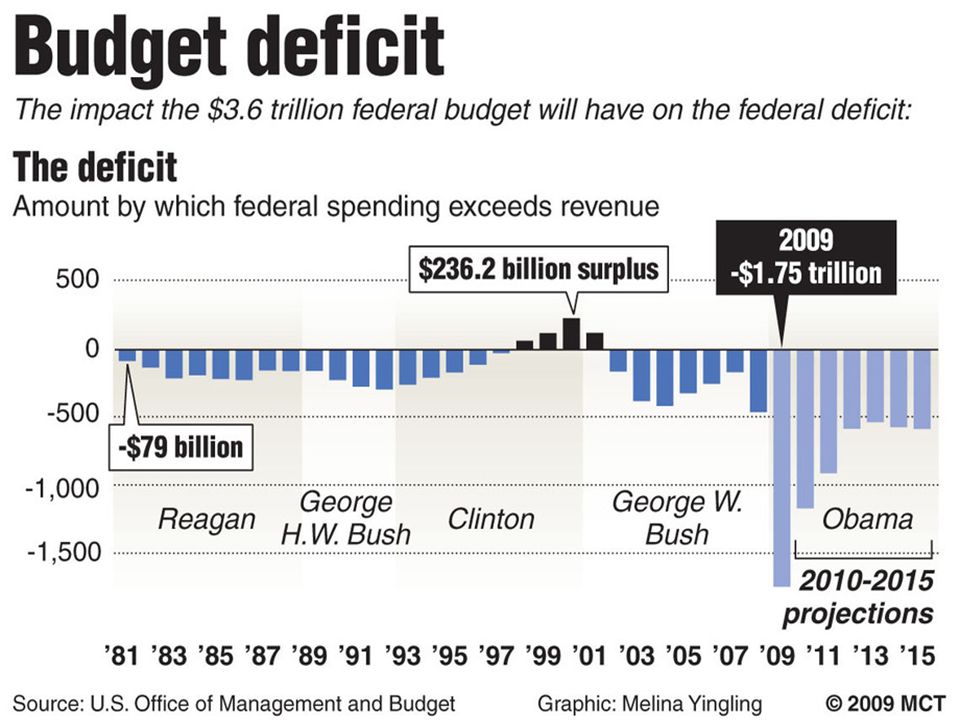
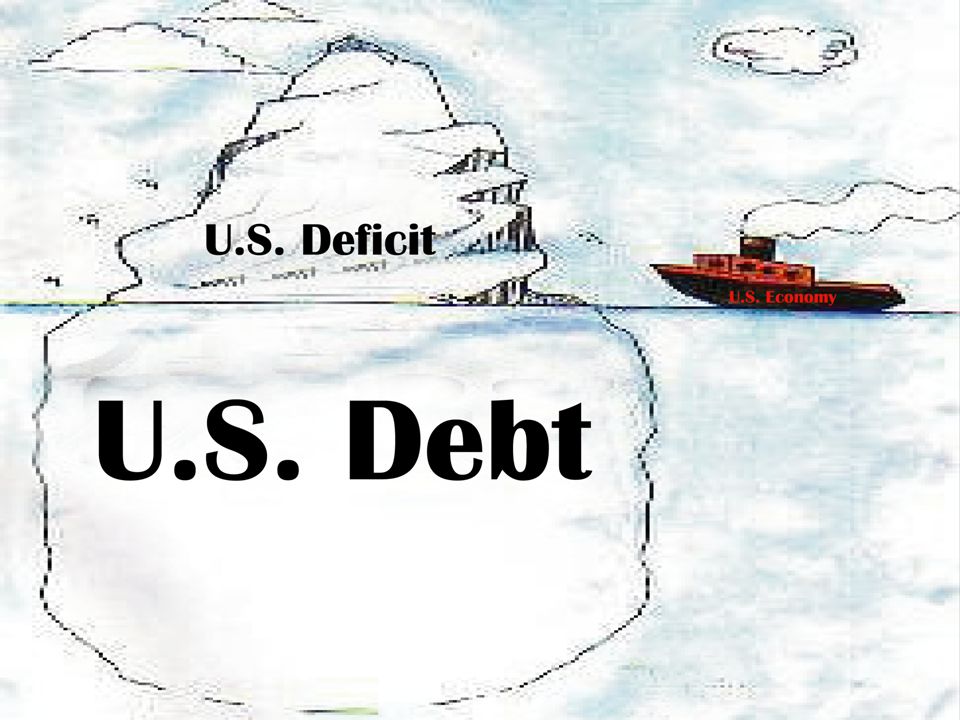
When there is a recessionary gap what two options does Congress have to fix it? What’s wrong with combining both? Deficit Spending!!!! A Budget Deficit is when the government’s expenditures exceeds its revenue. The National Debt is the accumulation of all the budget deficits over time. If the Government increases spending without increasing taxes they will increase the annual deficit and the national debt. 6

7
Paul Solomon Video: Deficit and Debt Ch. 30 7 US Debt Clock

8
Who ultimately pays for excessive government spending? 8

12
Video: Government Stages Coup 12

13
Additional Problems with Fiscal Policy 1.Problems of Timing Recognition Lag- Congress must react to economic indicators before it’s too late Administrative Lag- Congress takes time to pass legislation Operational Lag- Spending/planning takes time to organize and execute ( changing taxing is quicker) 2.Politically Motivated Policies Politicians may use economically inappropriate policies to get reelected. Ex: A senator promises more welfare and public works programs when there is already an inflationary gap. 13

14
3. Crowding-Out Effect In basketball, what is “Boxing Out”? Government spending might cause unintended effects that weaken the impact of the policy. Example: The government increases spending but must borrow the money (AD increases) This increases the price for money (the interest rate). Interest rates rise so Investment to fall. (AD decrease) The government “crowds out” consumers and/or investors 14 Additional Problems with Fiscal Policy
 This increases the price for money (the interest rate). Interest rates rise so Investment to fall. (AD decrease) The government crowds out consumers and/or investors 14 Additional Problems with Fiscal Policy.")
15
4. Net Export Effect International trade reduces the effectiveness of fiscal policies. Example: We have a recessionary gap so the government spends to increase AD. The increase in AD causes an increase in price level and interest rates. U.S. goods are now more expensive and the US dollar appreciates… Foreign countries buy less. (Exports fall) Net Exports (Exports-Imports) falls, decreasing AD. 15 Additional Problems with Fiscal Policy
 Net Exports (Exports-Imports) falls, decreasing AD. 15 Additional Problems with Fiscal Policy.")
16
Congressional Committees As a group, analyze the situation, identify the problem, and identify your solution 16 UnemploymentInflationGDP Growth Good6% or less1%-4%2.5%-5% Worry6.5%-8%5%-8%1%-2% Bad8.5 % or more9% or more.5% or less The Good, the Bad, and the Ugly

17
Activity 17

18
1.) 1933 Situation: GDP fell -1.2% Inflation rate= -.5% Unemployment Rate=25% Your Solution: 18
 1933 Situation: GDP fell -1.2% Inflation rate= -.5% Unemployment Rate=25% Your Solution: 18")
19
What actually happened: FDR increased public works via the New Deal programs. 19

20
2.) 1944 Situation: GDP grew 8% Inflation rate= 3.7% Unemployment Rate=1.2% Your Solution: 20
 1944 Situation: GDP grew 8% Inflation rate= 3.7% Unemployment Rate=1.2% Your Solution: 20")
21
What actually happened: War ended the next year and government orders for war materials decreased. Many public works programs were discontinued 21

22
3.) 1980 Situation: GDP fell -0.3% Inflation rate= 13.5% Unemployment Rate=7.1% Your Solution: 22
 1980 Situation: GDP fell -0.3% Inflation rate= 13.5% Unemployment Rate=7.1% Your Solution: 22")
23
What actually happened: The next year, President Regan and congress lowered taxes on individuals and corporations by about 30%. 23

24
4.) 2003 Situation: GDP fell 0.5% Inflation rate= 1.5% Unemployment Rate=12.0% Your Solution: 24
 2003 Situation: GDP fell 0.5% Inflation rate= 1.5% Unemployment Rate=12.0% Your Solution: 24")
25
What actually happened: Congress voted to give tax cuts to citizens. (Bush Tax Cuts) 25
 25")
26
2013 Situation: GDP fell -.1% Inflation rate= 2.1% Unemployment Rate=7.7% Your Solution: 26

27
What actually happened: Congress voted to let tax cuts expire. Increasing taxes 2% 27

28
Explain this cartoon 2003 28

Similar presentations

 of additional income that is.>")


 Joint Economic Committee (JEC)>")

the monetary value of all goods and services (final, intermediate, and non-market) produced in a given year. B)total resource income less.>")

 to Fiscal Policy Side Effects (Offsets) to Fiscal Policy Fiscal Policy not a perfect science/often trial.>")

>")

