Download presentation
Presentation is loading. Please wait.

1
PreCalculus 1-7 Linear Models

3
Our goal is to create a scatter plot to look for a mathematical correlation to this data

4
Linear Models Open a list and spreadsheet window

5
Linear Models Enter “depth” and “pressure” in the top rows of the first two columns

6
Linear Models Enter the data from the table

7
Linear Models To see this data in a scatter plot, go to home, and open a Data & Statistics window

8
Linear Models Select “depth” on the x-axis, and “pressure” on the y-axis

9
Linear Models Does this data appear to have a correlation?

10
Vocabulary Positive Correlation – data where the dependent variable tends to increase with the independent variable Negative Correlation – data where the dependent variable tends to decrease with the independent variable No Correlation – data where the dependent variable is not related to the independent variable

11
Linear Models – Quick Questions Examples of real world items with.. Positive correlation? Negative correlation? No correlation?

12
Linear Models Without a calculator, scatter plots can be done by hand On a TI-84, use the list feature

13
Linear Models If data has a correlation, then we can approximate the data with a straight line

14
Linear Models Add a line and pick two points to find the line’s equation

15
Linear Models Let the calculator add a line, and move it to a place you like Menu > 4 > 2

16
Linear Models Compare slopes and intercepts for the equations Menu > 4 > 2

17
Linear Models Write down your results, and clear the line on your screen ctrl - Z

18
Linear Models Let the calculator find the “best fit” line Menu > 4 > 6 > 1

19
Linear Models – Quick Questions What makes one model better than another? How might we compare the quality of the different lines? Positive versus negative approximations?

20
Vocabulary Sum of the squared differences – method to compare quality of best fit lines. Error amounts for each data point are squared then added together A smaller sum demonstrates a “Better” fit

21
Vocabulary Least Squares Regression Line – The model with the lowest sum of square differences

22
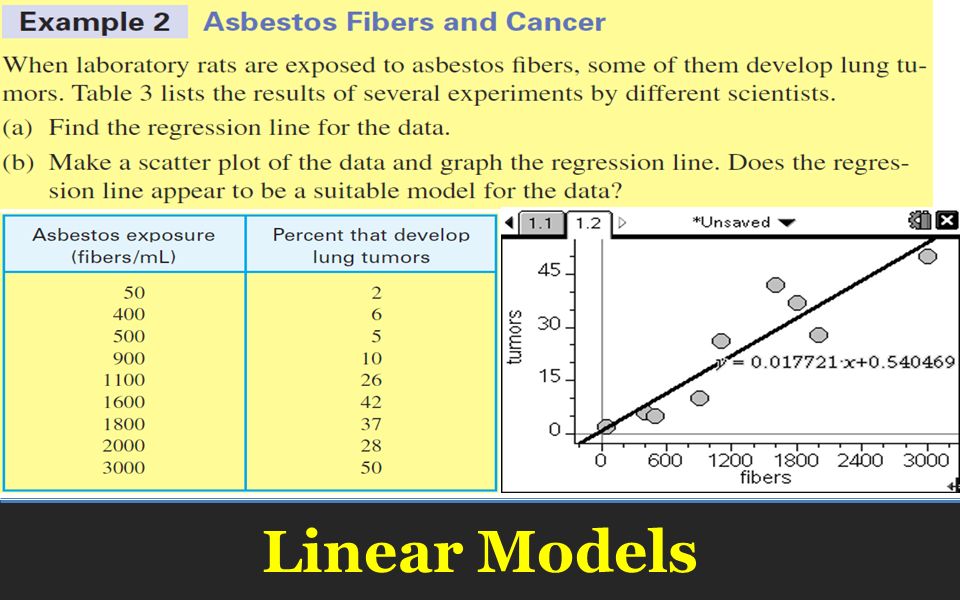
Linear Models

24
Vocabulary Correlation coefficient – statistical measure of the accuracy of a model to data. The closer the value of |r| is to one, the better the fit

25
Linear Models Calculators give the “r” value for comparison of different regression models

26
Linear Models y = 1.8807x + 82.65 191.7 cm

27
y = 16.4163x – 621.83938 cans

28
Homework Page 77 – 78 3-6, 11, 13

Similar presentations