Download presentation
Presentation is loading. Please wait.

2
Ashraf M. Mahmoud, Associate professor CHROMATOGRAPHYCHROMATOGRAPHY

3
Thin Layer Chromatography (TLC) High-Performance Liquid Chromatography (HPLC) Gas Chromatography (GC) Common Techniques of Chromatography Common Techniques of Chromatography
 High-Performance Liquid Chromatography (HPLC) Gas Chromatography (GC) Common Techniques of Chromatography Common Techniques of Chromatography")
5
What is the principle ? What is the Instrumentation ? What is the Applications of this Method ? For HPLC

6
time Respons e Principles of Column Chromatography

7
Instrumentation of HPLC Principles Behind the Instrument

8
Instrumentation of HPLC Mobile phase reservoir Solvent mixing valve Pump HPLC Chart Column Sample injection valve Recorder Waste Detector

9
Often the reservoirs contain a filtration system for filtering dust and particulate matters from the solvent to prevent these particles from damaging the pumps or injection valves or blocking the column. The reservoirs are equipped with a degasser for removing dissolved gases- usually oxygen and nitrogen-that interfere by forming bubbles in the column and the detector. Mobile-Phase Reservoir Mobile phase reservoir Solvent mixing valve Pump Chart Column injection valve Recorder Waste Detector

10
The Function: The pump provide a flow of the mobile-phase The pump provide a flow of the mobile-phase through the HPLC injector, column, and detector. through the HPLC injector, column, and detector. HPLC Pump Types of HPLC Pumps: Constant-Pressure Pump. Constant-Flow Pump. The requirements of standard HPLC pump include: Generation of pressures up to 6000 Ibs/in2. Pulse-free output. Flow rate ranging from 0.1 to 10 ml/min. Made of corrosion-resistant materials (stainless steel). Mobile phase reservoir Solvent mixing valve Pump Chart Column injection valve Recorder Waste Detector
. Mobile phase reservoir Solvent mixing valve Pump Chart Column injection valve Recorder Waste Detector.")
11
HPLC Pump Constant-Pressure Pump: Advantages: Simple, inexpensive, easy to operate, and free from pulsations, resulting in smooth baselines. Disadvantages: Flow rate must be monitored carefully and constantly. Causes: change in the solvent viscosity (due to change in the temperature) Causes: change in the solvent viscosity (due to change in the temperature) Effect: influence both qualitative and quantitative analysis. How:
 Causes: change in the solvent viscosity (due to change in the temperature) Effect: influence both qualitative and quantitative analysis. How:.")
12
How: change in the flow rate reflects on change in retention volume (used for matching in the qualitative analysis). The component location and identification becomes difficult. In quantitative analysis, the most common detectors (UV and refractive index) are concentration sensitive. Changes in flow rate affect the time that a chromatographic band passes through the detector, which changes the peak area (which is used for quantitation. This type is used only for column packing
 are concentration sensitive. Changes in flow rate affect the time that a chromatographic band passes through the detector, which changes the peak area (which is used for quantitation. This type is used only for column packing.")
13
Advantages: Ability to repeat elution volume and peak area (regardless of viscosity changes or column blockage, up to the pressure limit of the pump). Constant-Flow Pump: This type is the most widely used in all common HPLC applications

14
Sample Injection System The Function: Introduction of the samples into the HPLC system with high precision, without interruption of the mobile phase flow. Injection valve (loop) is preferred for quantitative analysis Mobile phase reservoir Solvent mixing valve Pump Chart Column injection valve Recorder Waste Detector
 is preferred for quantitative analysis Mobile phase reservoir Solvent mixing valve Pump Chart Column injection valve Recorder Waste Detector.")
15
HPLC Column The dimensions: 10-30 cm long 4-5 mm internal diameter. Packing material: Pellicular (spherical, non-porous, polymer beads with typical diameter of 30 to 40 m. Porous particles (porous silica particles with typical diameter of 3 to 10 m. Porous silica particles gives better column efficiency, sample capacity, and speed of analysis Mobile phase reservoir Solvent mixing valve Pump Chart Column injection valve Recorder Waste Detector Column

16
HPLC Detector The function: Monitoring the mobile phase as it emerges from the column. as it emerges from the column.. The ideal characteristics: 1. Adequate sensitivity for the particular task. 1. Adequate sensitivity for the particular task. 2. Good stability and reproducibility. 2. Good stability and reproducibility. 3. Wide linear dynamic range of response. 3. Wide linear dynamic range of response. 4. Short response time that is independent on flow rate. 4. Short response time that is independent on flow rate. 5. Insensitive to changes in solvent, flow rate, and temperature. 5. Insensitive to changes in solvent, flow rate, and temperature. 6. Cell design that eliminates remixing of the separated bands. 6. Cell design that eliminates remixing of the separated bands. 7. High reliability and ease of use. 7. High reliability and ease of use. 8. Non-destructive for the sample. 8. Non-destructive for the sample. Mobile phase reservoir Solvent mixing valve Pump Chart Column injection valve Recorder Waste Detector

17
HPLC Detector Types of HPLC Detectors: Bulk Property Detectors. Solute Property Detectors. Respond to some physical property of the mobile-phase : Respond to some physical property of the mobile-phase (refractive index, dielectric constant, or density). Advantages: they are universal in application. Advantages: they are universal in application. Disadvantages: they have poor sensitivity and limited range Disadvantages: they have poor sensitivity and limited range
. Advantages: they are universal in application. Advantages: they are universal in application. Disadvantages: they have poor sensitivity and limited range Disadvantages: they have poor sensitivity and limited range.")
18
Solute Property Detectors. They respond to some physical or chemical property of solutes (UV absorbance, fluorescence, or diffusion current). (UV absorbance, fluorescence, or diffusion current). Advantages: They high sensitivity and a wide range. Disadvantages: They are more selective; more than one detector may be required to meet the demands of an analytical problem. demands of an analytical problem. HPLC Detector
. (UV absorbance, fluorescence, or diffusion current). Advantages: They high sensitivity and a wide range. Disadvantages: They are more selective; more than one detector may be required to meet the demands of an analytical problem. demands of an analytical problem. HPLC Detector.")
19
Type TypeResponse Sensitivity Sensitivity (ng/mL) (ng/mL) Refractive index Universal 1000 1000 ConductimetricSelective 100 100 UV/visible absorption Selective 10 10 Mass-spectrometrySelective 0.1 0.1 FluorescenceSelective 0.001 0.001 HPLC Detector Characteristics of Typical HPLC Detectors :
 (ng/mL) Refractive index Universal ConductimetricSelective UV/visible absorption Selective Mass-spectrometrySelective FluorescenceSelective HPLC Detector Characteristics of Typical HPLC Detectors :")
20
HPLC Recorder Sample injected Peaks correspond to individual components Mobile phase reservoir Solvent mixing valve Pump Chart Column injection valve Recorder Detector Waste

21
Silica Gel: Polymers of polysilicic acid The OH groups attached to silicon atoms are reactive and account for the adsorptive properties of silica gel. properties of silica gel. Substances are adsorbed on silica gel via hydrogen bonding, and the surface hydroxyls serve as hydrogen donors. Si Si O OH O O O O O How we Can Select the HPLC Method ? How we Can Select the HPLC Method ? Adsorption Chromatography Alumina: Crystalline modifications of Al 2 O 3. Physical properties of alumina are similar to silica in terms of particle size, surface area, and average pore diameter.

22
Reversed-Phase Normal-Phase OH OH OH OH OH OH OH OH Polar stationary phase Polar stationary phase Non-polar mobile phase CH 3 No-Polar stationary phase No-Polar stationary phase Polar mobile phase Polar mobile phase Highlypolar Moder-atelypolar Nonpolar Highlypolar Moder-atelypolar Nonpolar Types of Partition Chromatography

23
Sephadex: Prepared from modified dextran gels that have an open network (molecular sieve) formed as a result of cross-linking. Sephadex gels are used for separation of hyrophilic solutes (peptides and nucleic acid) based on their molecular size. Size Exclusion Chromatography
 based on their molecular size. Size Exclusion Chromatography.")
24
Ion Exchanger: Chemically-modified HMW cross-linked polymers with attached ionic groups (anions or cations). These ionic groups are exchanged with ions of the same charge in the mobile phase. Anion exchange NR 3 OOCH 3 NH 4 - + + + Cation exchane SO 3 - Na HCOO + - + - + NH 3 Aln OOCH 3 NH 4 - + O Ph - Ion Exchange Chromatography

25
IonExchange Adsorption 10 2 10 3 Partition Nonionic polar Reversed-phase Normal-phase Gel permeation Gel filtration Sample Water-insolubleWater-soluble NonpolarIonic 10 4 Molecular weight Exclusion How we Can Select the HPLC Method ? How we Can Select the HPLC Method ?

26
What is the Applications of HPLC ? What is the Applications of HPLC ? Qualitative Analysis Purification of Compounds Identification of Compounds Peaks correspond to individual components CompoundImpurity Separation of Mixture ComponentsAuthentic Unknown

27
Quantitative Analysis 0 10 5 g/mL 0 10 10 g/mL 0 10 25 g/mL 0 10 50 g/mL 0 10 75 g/mL 0 10 100 g/mL 0 10 Unknown Concentration Peak hight Calibration curve External Standard Method

28
Quantitative Analysis Concentration Peak hight ratio Calibration curve Internal Standard Method 0 10 5 g/mL 0 10 10 g/mL 0 10 25 g/mL 0 10 50 g/mL 0 10 75 g/mL 0 10 100 g/mL Internal Standard Compound 0 10 Unknown

29
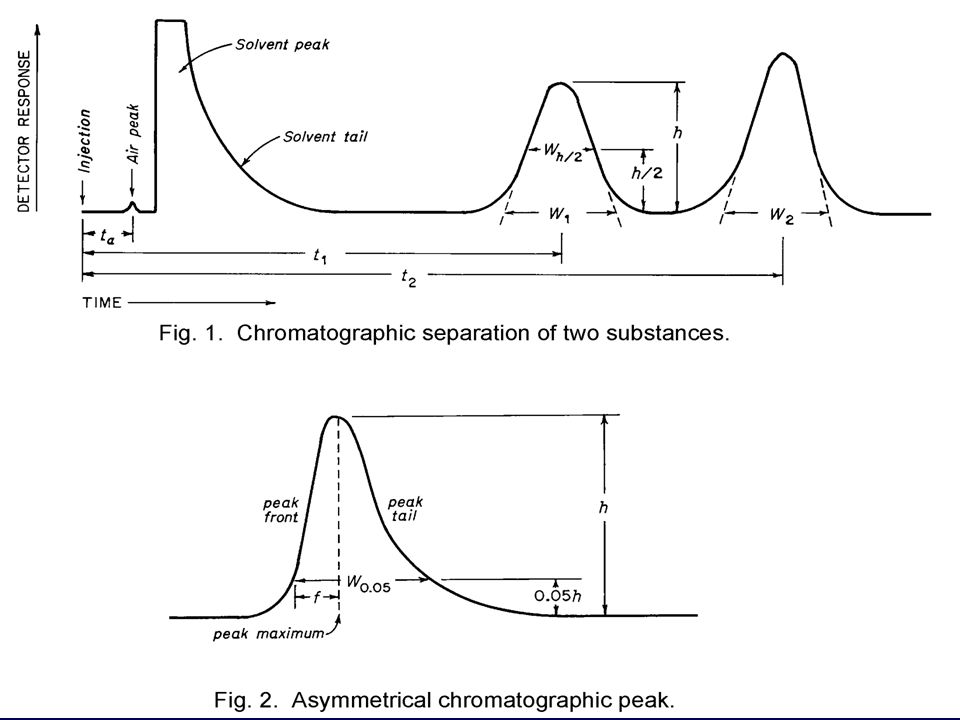
Peak Base: An interpolation of the base line between the extremities of the peak.. Peak Area: The area enclosed by the peak and the peak base. Peak Height: The distance from the peak maximum to the peak base. Peak Width (t W ): The magnitude of the peak base intercepted by the tangents to the inflection points of the peak. Retention time (t R ): The time between sample injection and the appearance of a solute peak at the detector of a chromatographic column. Dead time (t m ): The time it takes for an unretained species (mobile phase) to pass through a column. Adjusted Retention Time (t R ' ) is the time solute spent in the stationary phase and equals to [ t R - t m ].
: The magnitude of the peak base intercepted by the tangents to the inflection points of the peak. Retention time (t R ): The time between sample injection and the appearance of a solute peak at the detector of a chromatographic column. Dead time (t m ): The time it takes for an unretained species (mobile phase) to pass through a column. Adjusted Retention Time (t R ) is the time solute spent in the stationary phase and equals to [ t R - t m ]..")
31
The Capacity Factor (k') is used to describe the migration rates of solutes on columns, It is defined as: For solute A, k A ' = (t R,A – t 0 )/t 0 ; = t' R,A /t 0 The Selectivity Factor ( ) of a column for the two solutes A and B in a mixture is defined as = k' B /k' A Chromatoaraohic column efficiency is determined by 1- Plate height (Height Equivarent to Theoretical Plate (HETP)= L/N 2- Number of Theoretical Plates(N) =16 (t R /t W ) 2 L = length of column Resolution of the column (Rs) = (t R,B – t R,A )/0.5 (t w,A +t W,B ) R s = √N/4 x [α-1]/ α x [k' B /(k' B +1)] Column efficiency Selectivity Capacity
![ The Capacity Factor (k ) is used to describe the migration rates of solutes on columns, It is defined as: For solute A, k A = (t R,A – t 0 )/t 0 ; = t R,A /t 0 The Selectivity Factor ( ) of a column for the two solutes A and B in a mixture is defined as = k B /k A Chromatoaraohic column efficiency is determined by 1- Plate height (Height Equivarent to Theoretical Plate (HETP)= L/N 2- Number of Theoretical Plates(N) =16 (t R /t W ) 2 L = length of column Resolution of the column (Rs) = (t R,B – t R,A )/0.5 (t w,A +t W,B ) R s = √N/4 x [α-1]/ α x [k B /(k B +1)] Column efficiency Selectivity Capacity](http://images.slideplayer.com/35/10413115/slides/slide_31.jpg " The Capacity Factor (k ) is used to describe the migration rates of solutes on columns, It is defined as: For solute A, k A = (t R,A – t 0 )/t 0 ; = t R,A /t 0 The Selectivity Factor ( ) of a column for the two solutes A and B in a mixture is defined as = k B /k A Chromatoaraohic column efficiency is determined by 1- Plate height (Height Equivarent to Theoretical Plate (HETP)= L/N 2- Number of Theoretical Plates(N) =16 (t R /t W ) 2 L = length of column Resolution of the column (Rs) = (t R,B – t R,A )/0.5 (t w,A +t W,B ) R s = √N/4 x [α-1]/ α x [k B /(k B +1)] Column efficiency Selectivity Capacity")
32
Example: Substances A and B have retention times of 16.4 and 17.63 min; respectively, on a 30-cm column. An unretained species passes through the column in 1.30 min. The peak widths (at base) for A and B are 1.11 and 1.21 min, respectively. Calculate: (a) column resolutIon, (b) average number of plates in the column, (c) plate height, (d) length of column required to achieve. resolution of 1.5, and (e) time required to elute substance B on the longer column. (a.) Calculate the column resolution. R s = (2((t R ) y - (t R ) x ))/(W x + W y ) R s = (2(17.63 min - 16.4 min))/( 1.11 min + 1.21 min) = 1.06 (b.) Average number of plates N = 16 * (t R /W) 2 for peak A N = 16 * (16.4/1.11) 2 = 3493 plates for peak B N = 16 * (17.63/1.21) 2 = 3397 plates Average av N = (3493 + 3397)/2 plates = 3445 plate (c.) Height equivalent of a theoretical plate H = L/N = (30 cm/3445 plates) = 0.0087 cm/plate
 for A and B are 1.11 and 1.21 min, respectively. Calculate: (a) column resolutIon, (b) average number of plates in the column, (c) plate height, (d) length of column required to achieve. resolution of 1.5, and (e) time required to elute substance B on the longer column. (a.) Calculate the column resolution. R s = (2((t R ) y - (t R ) x ))/(W x + W y ) R s = (2(17.63 min min))/( 1.11 min min) = 1.06 (b.) Average number of plates N = 16 * (t R /W) 2 for peak A N = 16 * (16.4/1.11) 2 = 3493 plates for peak B N = 16 * (17.63/1.21) 2 = 3397 plates Average av N = ( )/2 plates = 3445 plate (c.) Height equivalent of a theoretical plate H = L/N = (30 cm/3445 plates) = cm/plate.")
Similar presentations


 Gas Chromatography>")


 give high performance but require high pressure 1. Scope of LC Four types of liquid chromatography -Partition - Adsorption (liquid-solid)>")
 is the most versatile and widely used type of elution chromatography.>")


 Supercritical.>")


 Theoretical Plate Model Performance parameters (Advanced) Theoretical Plate Model.>")
