Download presentation
Presentation is loading. Please wait.

1
Chapter 6 Test Review

2
....9200 z area ararea ea 0.0400

3
The critical value for a 90% confidence level is 1.645.

4
A random sample of 125 students has a grade point average with a mean of 2.94 and with a standard deviation of 0.77. Construct the confidence interval for the population mean, μ, if the confidence level is 95%. The sample size is ≥ 30, so the Central Limit Theorem tells us the sampling distribution is approximately. We can use the normal distribution. The critical value for a 95% confidence level is 1.96. The population standard deviation is unknown, however we can use the sample standard deviation in its place.

5
A random sample of 125 students has a grade point average with a mean of 2.94 and with a standard deviation of 0.77. Construct the confidence interval for the population mean, μ, if the confidence level is 95%.

6
Interpret the confidence interval. We are 95% confident that the interval from 2.81 to 3.07 captures the actual population mean.

7
The standard IQ test has a mean of 100 and a standard deviation of 13. We want to be 97% confident that we are within 3 IQ points of the true mean. Determine the required sample size. First, we need the critical value for the 97% confidence level.

8
The standard IQ test has a mean of 100 and a standard deviation of 13. We want to be 97% confident that we are within 3 IQ points of the true mean. Determine the required sample size.

9
The required sample size is at least 89 Round up to the next whole number. Square both sides

10
Here we use the t-distribution table. First, we need the degrees of freedom. Go to the t-distribution table. Line up the degrees of freedom, 19, with the confidence level,.90.

11
Find the value of the margin of error for a 95% confidence level for a sample size of 10 with a standard deviation of 3.9. Assume the population is approximately distributed. The sample size is less than 30. The population standard deviation is unknown. The population is approximately distributed. We can use the t-distribution. First, we need the degrees of freedom.

12
Find the value of the margin of error for a 95% confidence level for a sample size of 10 with a standard deviation of 3.9. Assume the population is approximately distributed. Go to the t-distribution table. Line up the degrees of freedom, 9, with the confidence level,.95. Use the number from the table.

13
Find the value of the margin of error for a 95% confidence level for a sample size of 10 with a standard deviation of 3.9. Assume the population is approximately distributed.

14
In a random sample of 28 families, the average weekly food expense was $95.60 with a standard deviation of $22.50. Determine whether a normal distribution or a t- distribution should be used or whether neither of these can be used to construct a confidence interval. Assume the distribution of weekly food expenses is normally shaped. No Is the population normally shaped? Yes Do we know the population standard deviation? No A)Use the t-distribution. B)Use the normal distribution. C)Cannot use the normal distribution or t-distribution. Correct answer
Use the t-distribution. B)Use the normal distribution. C)Cannot use the normal distribution or t-distribution. Correct answer.")
15
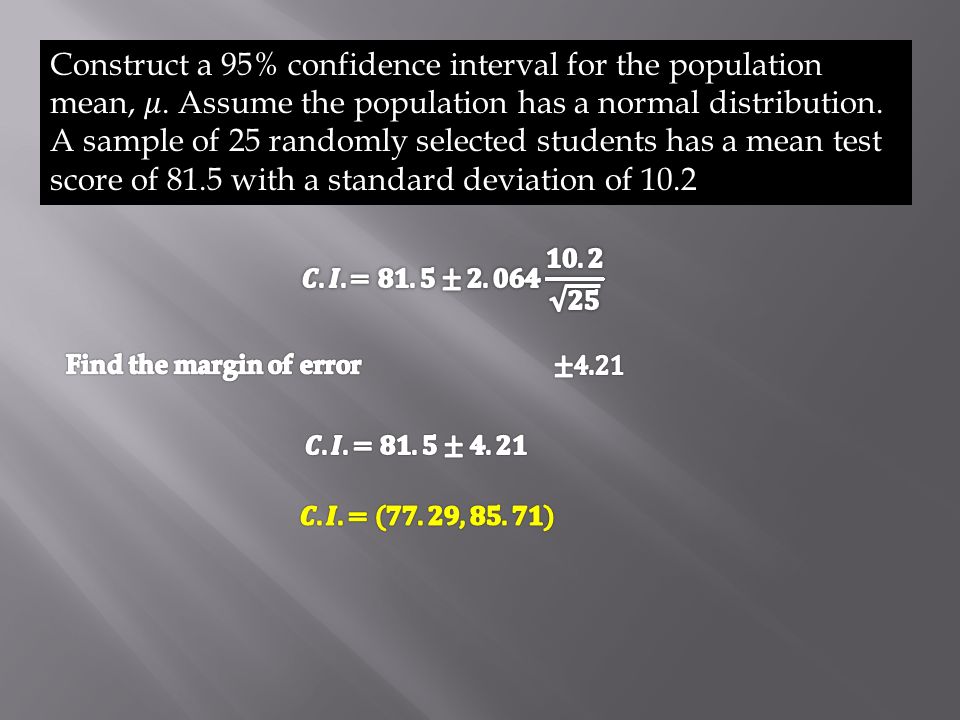
Find the degrees of freedom? 24 2.064

17
Interpret the confidence interval.

18
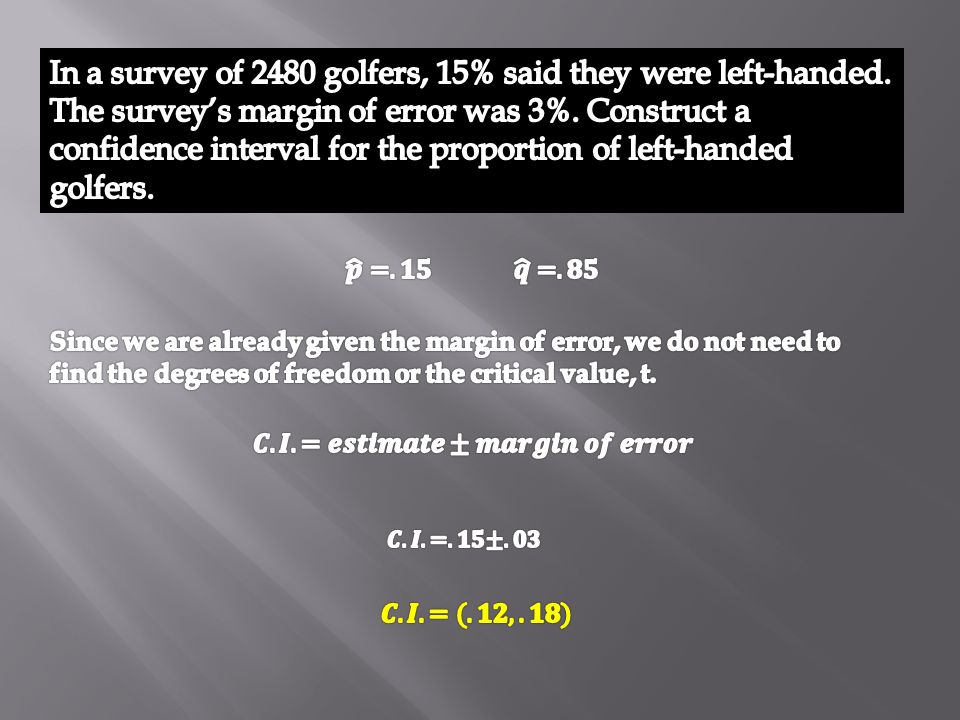
When 475 college seniors were surveyed, 125 said they had taken a college statistics course. Find a point estimate p, the population proportion of college seniors who had taken a college statistics course. Round to two decimal places.

21
Interpret the confidence interval.

22
In a survey of 10 golfers, 2 were found to be left-handed. Is it practical to construct the 90% confidence interval proportion, p?. Explain.

23
A pollster wishes to estimate the proportion of U.S. voters who favor capital punishment. How large a sample is needed to be 90% confident that the sample proportion will not differ from the true proportion by more than 4%?

25
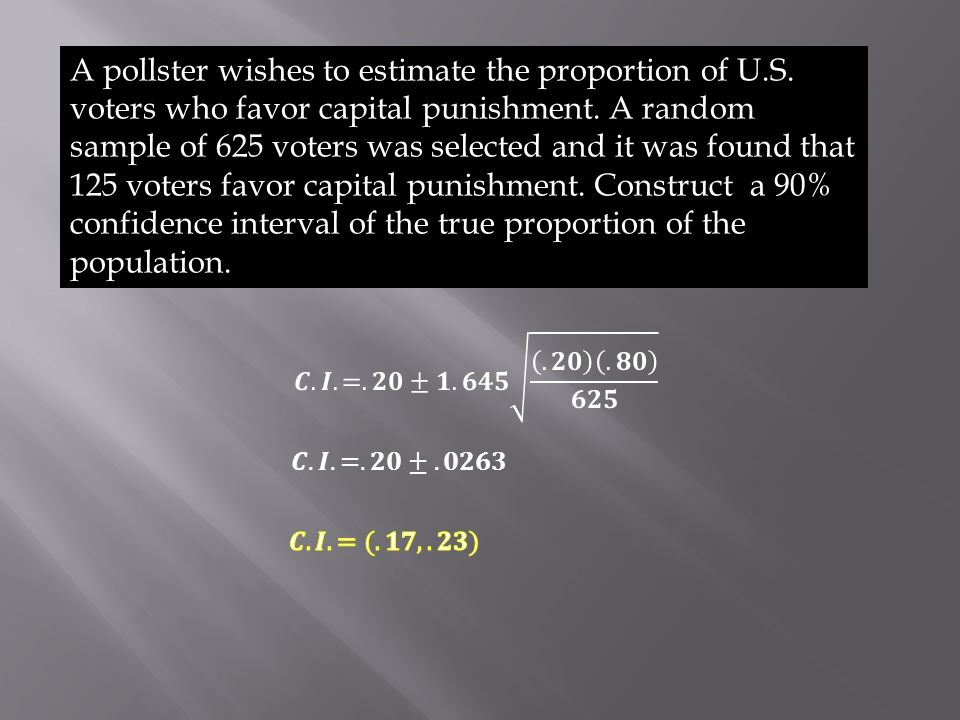
A pollster wishes to estimate the proportion of U.S. voters who favor capital punishment. A random sample of 625 voters was selected and it was found that 125 voters favor capital punishment. Construct a 90% confidence interval of the true proportion of the population.

Similar presentations


 © 2006 Prentice-Hall, Inc. Chap 8-1 Chapter 8 Confidence Interval Estimation Business Statistics, A First Course.>")
 (Small Samples)>")


>")


 HAWKES LEARNING SYSTEMS math courseware specialists Copyright © 2008 by Hawkes Learning Systems/Quant.>")


>")
 6.2 Confidence Intervals for the Mean (Small.>")
