Download presentation
Presentation is loading. Please wait.

1
7.1 How have cities grown and what challenges do they face? 7.1b Cities face a number of SOCIAL and ENVIRONMENTAL CHALLENGES resulting from RAPID GROWTH and RESOURCE DEMANDS.

2
Task

3
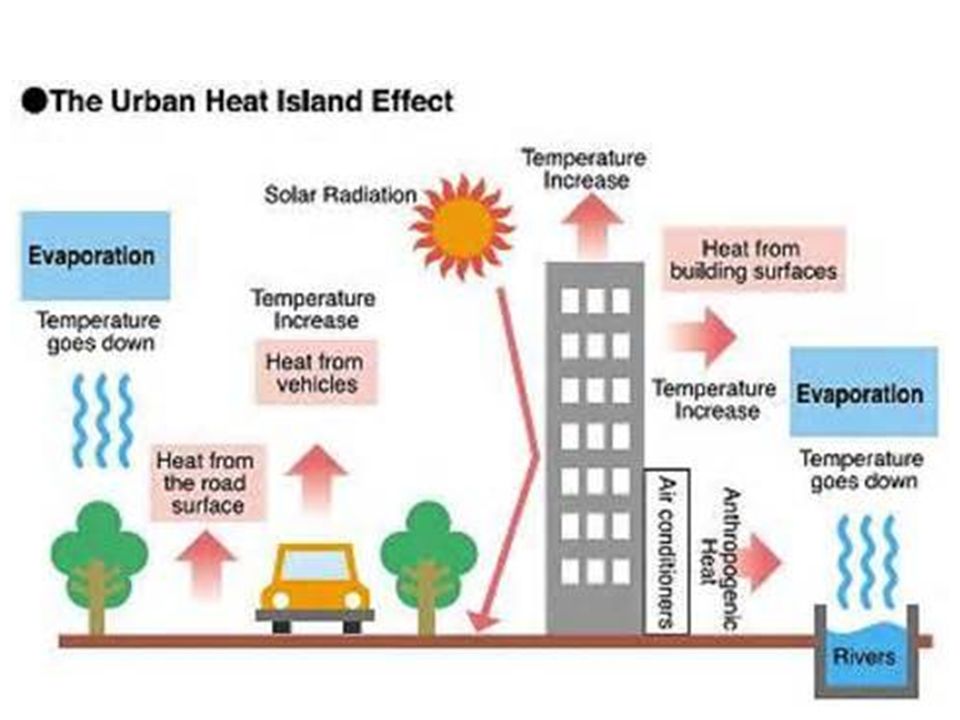
What are the challenges London faces due to increasing RESOURCE DEMANDS? What are all these images about? Lesson 3- Today we will EXAMINE the ENVIRONMENTAL and SOCIAL URBAN CHALLENGES in the DEVELOPED world.

4
Urban regions and their eco- footprints What is the Ecological footprint of a Country? The Ecological Footprint of a country is defined as the land and natural resources required to provide the raw materials on which the country along with its population feeds, and process the waste products it produces. We use the natural environment as a SOURCE- to obtain things for our needs We also use as a SINK- to dispose of all our waste products These SOURCES and SINKS represents the amount of land, water and air (BIPRODUCTIVE AREAS) needed to support our lifestyles This is expressed in the measurement GLOBAL HECTARES (GHA)
 needed to support our lifestyles This is expressed in the measurement GLOBAL HECTARES (GHA).")
5
London’s Eco-footprint? Our footprints now extend far beyond places we live in as we no longer produce, consume and dispose of everything we need in our local area. Lets expand on this, by looking at the components which make up an eco-footprint- 1)Food we eat 2)Transport we use 3)Housing we live in 4)Entertainment and leisure services 5)All consumer goods- clothes, electricals and all energy it takes to produce and transport it 6)Infrastructure- water and power supplies, health and education services, transport network improvements 7)Public services- resources used by councils to support our lifestyles- refuse collection, highway and park maintenance, street furniture, etc Carbon Footprint- measure of the carbon emissions included in our eco- footprint (the mark we leave on Earth- damaging it)
Food we eat 2)Transport we use 3)Housing we live in 4)Entertainment and leisure services 5)All consumer goods- clothes, electricals and all energy it takes to produce and transport it 6)Infrastructure- water and power supplies, health and education services, transport network improvements 7)Public services- resources used by councils to support our lifestyles- refuse collection, highway and park maintenance, street furniture, etc Carbon Footprint- measure of the carbon emissions included in our eco- footprint (the mark we leave on Earth- damaging it).")
6
How do footprints vary across London?

7
YOU HAVE TO UNDERSTAND THE SOCIAL AND ENVIRONMENTAL IMPACTS THAT THE INCREASE IN RESOURCE CONSUMPTION LONDON

8
Water Security (safe, reliable supply) of water is vital to DEVELOPED WORLD cities and how they function Each person in London consumes 161 litres of water per day London’s water consumption is far greater than supply, leading to OVERABSTRACTION of GROUNDWATER London’s rainfall is lower than the national average (supply is low) and it has the largest population (high demand) So water has to be transferred which increases the COST and risks the SUPPLY London also has a DESALINISATION plant, which is costly and further increases water costs to Londoners London has larger numbers of single occupancy homes which consume more water per person than higher occupancy residences 866 billion litres per year. 94 million litres of bottled water in 2260 tonnes of plastic

9
3 million private cars in London as well as 8,500 buses and 18,000 black cabs, plus coaches, lorries, underground and over ground trains Car ownership in London is 34 per 1000 people so despite the 408 km of underground rail network there are a lot of vehicles on the roads. traffic congestion particularly at peak times is a major issue. 41% of the nitrogen dioxide pollution in London comes from car exhaust fumes Nitrogen dioxide can lead to increases in asthma and other chest problems A slow moving vehicle releases more pollutants into the air than one moving at a normal pace. CO2 leads to the ENHANCED GREENHOUSE EFFECT Road traffic contributes 22% of London’s co2 output.

10
8.6 million people and the thousands of businesses in London all generate a lot of waste, which has to be removed from the city or disposed of safely. London generates about 20 million tonnes of waste each year, much of which is still buried in landfill sites. The annual cost to London of sending waste to landfill is £260m(2011) and by 2014 this will be £280 m. the green waste and food which goes to landfill generates methane as it decays, this adds 460,000 tonnes each year to the greenhouse gases in the atmosphere above London. Some of this waste leaks out into rivers and contaminates water supply Some waste is INCINERATED or burnt which releases GREENHOUSE GASES into the atmosphere, further adding to the ENHANCED GREENHOUSE EFFECT
 and by 2014 this will be £280 m. the green waste and food which goes to landfill generates methane as it decays, this adds 460,000 tonnes each year to the greenhouse gases in the atmosphere above London. Some of this waste leaks out into rivers and contaminates water supply Some waste is INCINERATED or burnt which releases GREENHOUSE GASES into the atmosphere, further adding to the ENHANCED GREENHOUSE EFFECT.")
11
Where does London waste go? 33% of London’s waste goes to Mucking in Essex 22% goes to landfill in Kent Hertfordshire takes 13% Bedfordshire, Buckinghamshire, Berkshire and Oxfordshire take 8% each

12
The more residents, the more energy is demanded and London’s population is increasing 18% of all the energy that goes into London is wasted 13.2 million tonnes oil equivalent made up of 21% electricity 23% liquids 55% gases <1% renewable Most (95%) of London's energy is generated by burning FOSSIL FUELS, this leads to the ENHANCED GREENHOUSE EFFECT Burning coal increases London’s CARBON FOOTPRINT For London to continue to compete at a world level and generate money it needs to run 24 hours a day, open buildings and workplaces 24 hours a day consume more energy, further increasing DEMAND. ALL London’s energy is imported

14
Most food Londoner consume (81%) is NOT grown in London or even close by So….. It has to be TRANSPORTED by road, rail, air or train…….. FOOD MILES- distance food travels from field to plate.. The further the food comes from the higher its carbon footprint is… CARBON FOOTPRINT- amount of CO2 produced by something CO2 is a GREENHOUSE GAS, which contributes to CLIMATE CHANGE ARRANGE THESE STATEMENTS IN ORDER AN SUMMARISE IN YOUR NOTES

15
OVERCROWDING- HIGH RISK OF DISEASE SPREADING ACCESS TO HOUSING Explain how the size of London can lead to these problems occurring

16
OVERCROWDING- HIGH RISK OF DISEASE SPREADING ACCESS TO HOUSING As more people enter London the space per person reduces, leading to overcrowding, this can cause social problems as people feel cramped. People can begin to become more aggressive leading to increases fights and trouble on the street. As there are a higher number of migrants and tourists in London, diseases like TB are more common, as in other countries immunisations are not available or used. The overcrowding also leads to closer contact between large numbers of people, making it easier for those diseases to spread round the population. As more people enter London, government cannot build housing to keep up with demand. Rich people pay high prices, increasing house prices and high demand keeps rent high, pricing locals out of housing in many areas.

17
Task- MIND MAP/ FACTSHEET Create a mind map/ factsheet that looks at the problems created by the population of DEVELOPED world cities like LA or London. Make sure you include these problems- TRANSPORT PROVISION WASTE ENERGY USE WATER SUPPLY FOOD supply Ensure you divide the problems into ENVIRONMENTAL and SOCIAL

18
EXAM PRACTICE Explain the environmental challenges resulting from increases resource demands in a DEVELOPED world city you have studied (8)
")
Similar presentations