Download presentation
Presentation is loading. Please wait.

1
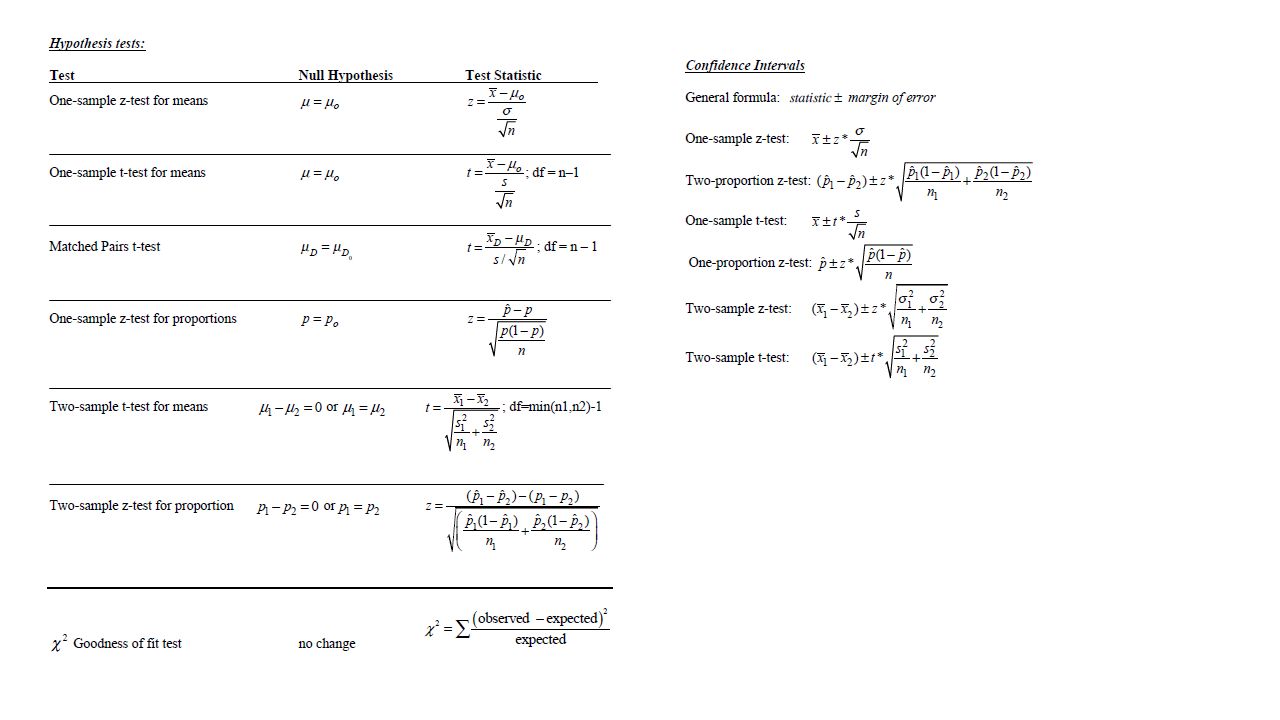
MATH 2311-06 Test 3 Review

3
A SRS of 81 observations produced a mean of 250 with a standard deviation of 22. Determine the 95% confidence interval for the population mean.

4
A random sample of 64 observations produced a sample proportion of 0.23. Determine the 95% confidence interval for the population proportion.

5
After performing a p-test, the P-Value is found to be smaller than the significance level. How should you proceed?

6
Which of the following will increase the width of the sample mean? Decrease the sample size Increase the confidence level Increase the sample size Decrease the confidence level Increase the value of the mean Decrease the value of the mean

7
The weights of pennies produced by the US Mint is determined to have a standard deviation of 0.02 grams. You wish to create a mean confidence interval of level 90%. How large of a sample of pennies should you select to have a margin of error of.02?

8
A one-sample z-statistic for a test of Ho: μ=53, and Ha: μ>53 based of 75 observations is z = 1.837. Determine the p-value.

9
An assortment of candies claims that their sample bag contains the following: 15% Snickers, 35% Milky Way, 25% Three Musketeers, 15% Almond Joy and 10% Mounds. From a bag of 200 candies, you find there are 30 Snickers, 35 Milky Way, 40 Three Musketeers, 45 Almond Joy and 50 Mounds. What type of test should you run, and what is the test statistic?

10
Various studies state that, worldwide, 1% of persons suffer from Autism. You believe that this number should be higher. You take an SRS of 500 people and find that 8 people have Autism. Test your claim with 5% significance. Determine your Null and Alternate Hypothesis.

11
Various studies state that, worldwide, 1% of persons suffer from Autism. You believe that this number should be higher. You take an SRS of 500 people and find that 8 people have Autism. Test your claim with 5% significance. Determine your rejection region.

12
Various studies state that, worldwide, 1% of persons suffer from Autism. You believe that this number should be higher. You take an SRS of 500 people and find that 8 people have Autism. Test your claim with 5% significance. Calculate your test statistic.

13
Various studies state that, worldwide, 1% of persons suffer from Autism. You believe that this number should be higher. You take an SRS of 500 people and find that 8 people have Autism. Test your claim with 5% significance. Determine your p-value.

14
Various studies state that, worldwide, 1% of persons suffer from Autism. You believe that this number should be higher. You take an SRS of 500 people and find that 8 people have Autism. Test your claim with 5% significance. Draw a conclusion.

15
It is determined that the mean number of car accidents teenage drivers experience is 4. You collect data from 20 twenty-year olds and find their mean number of accidents was 6.3 with a standard deviation of 0.2. Test, with a significance of 5%, if there is doubt in the accepted mean. Determine your Null and Alternate Hypothesis.

16
It is determined that the mean number of car accidents teenage drivers experience is 4. You collect data from 20 twenty-year olds and find their mean number of accidents was 6.3 with a standard deviation of 0.2. Test, with a significance of 5%, if there is doubt in the accepted mean. Determine your rejection region.

17
It is determined that the mean number of car accidents teenage drivers experience is 4. You collect data from 20 twenty-year olds and find their mean number of accidents was 6.3 with a standard deviation of 0.2. Test, with a significance of 5%, if there is doubt in the accepted mean. Calculate your test statistic.

18
It is determined that the mean number of car accidents teenage drivers experience is 4. You collect data from 20 twenty-year olds and find their mean number of accidents was 6.3 with a standard deviation of 0.2. Test, with a significance of 5%, if there is doubt in the accepted mean. Determine your p-value.

19
It is determined that the mean number of car accidents teenage drivers experience is 4. You collect data from 20 twenty-year olds and find their mean number of accidents was 6.3 with a standard deviation of 0.2. Test, with a significance of 5%, if there is doubt in the accepted mean. Draw a conclusion.

Similar presentations


: Alternative Hypothesis (H 1 ): a statistical analysis used to decide which of two competing.>")

>")


 Decision Making (Hypothesis Testing) A formal method for decision making in the presence of.>")


.>")