Download presentation
Presentation is loading. Please wait.

2
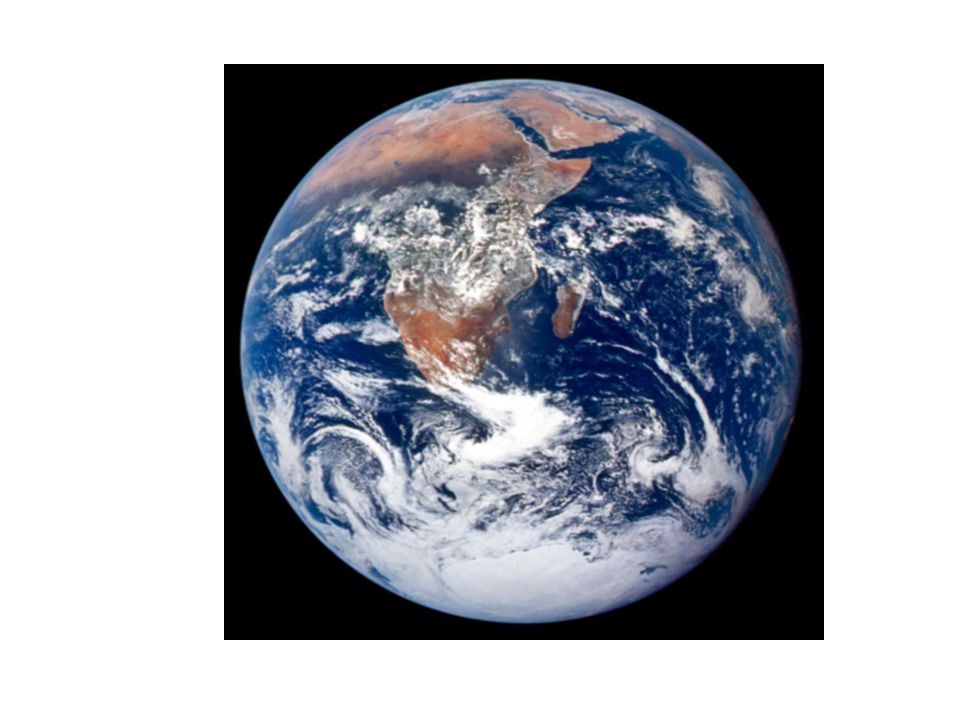
From the Back

3
Global Warming

4
Rising Sea Levels

5
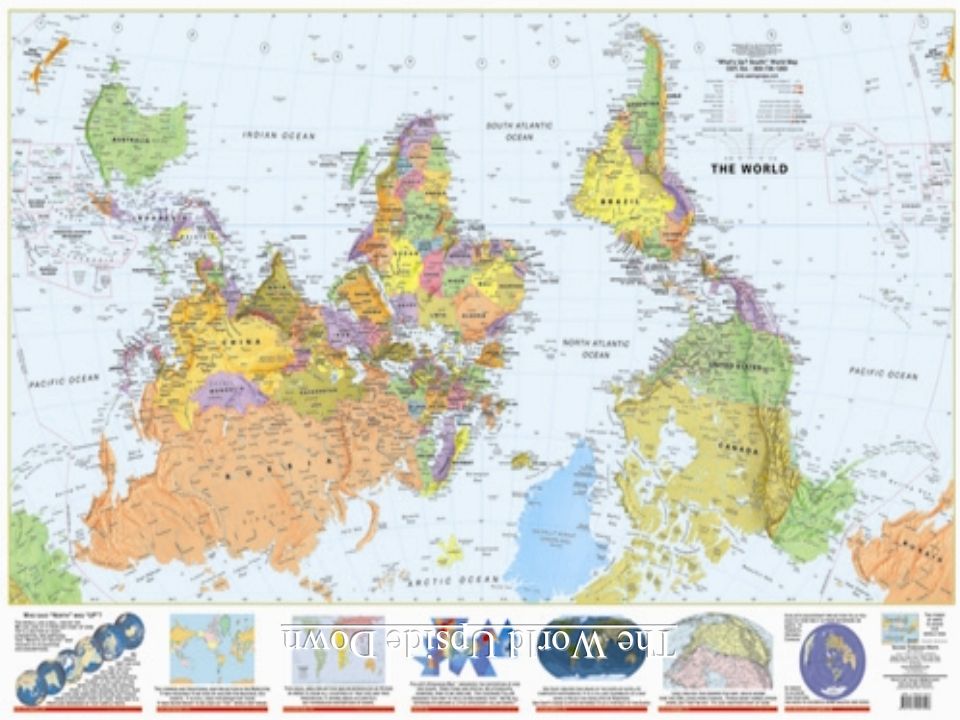
The World Map

6
Another World Map

7
Mercator Projection perfect shape; distorted size

8
Mercator's projection * Created 1569 by Mercator (whose name was actually Gerhard Kremer, 1512- 1594) - Still a favorite with sailors and pilots
 - Still a favorite with sailors and pilots")
9
Greenland: 0.8 million sq. miles Africa: 11.6 million sq. miles

10
Peter’s Projection perfect size; distorted shape

11
Peter’s Projection Presented in 1973 by Dr. Arno Peter’s Designed to eliminate Eurocentrism

12
Mollweide Projection The Mollweide projection, developed in 1805, is commonly used for displaying distributions (people, telecommunications equipment, the world's religions, etc).
.")
13
Eckert IV Projection

14
Goode’s Homolosine

15
Van der Grinten Projection Developed in 1904 - the official projection of the National Geographic Society from 1922 to 1988.

16
Robinson Projection From 1988 to 1998 the National Geographic Society used the Robinson projection (created in 1963 by Arthur H. Robinson).
..")
17
Winkel Tripel Projection Recently the National Geographic Society adopted the Winkel Tripel projection. Oswald Winkel developed this projection in 1921, and it has the advantage of minimizing shape distortion in the polar areas.

19
Political Map of the World

20
The World - Population Based

21
By Gross Domestic Product

22
Child Mortality

23
HIV / AIDS

24
Healthcare Spending

25
Energy Consumption

26
Greenhouse Gas Emission

28
Happiest People on Earth (according to U.Leicester study) 1. Denmark 2. Switzerland 3. Austria 4. Iceland 5. The Bahamas 6. Finland 7. Sweden 8. Bhutan 9. Brunei 10. Canada 11. Ireland 12. Luxembourg 13. Costa Rica 14. Malta 15. The Netherlands 16. Antigua and Barbuda 17. Malaysia 18. New Zealand 19. Norway 20. The Seychelles Other notable results include: 23. USA 35. Germany 41. UK 62. France 82. China 90. Japan 125. India 167. Russia The three least happy countries were: 176. Democratic Republic of the Congo 177. Zimbabwe 178. Burundi

29
Religions of the World

30
Languages of the world (Each dot represents the geographic center of one of the 6,912 dialects)
")
31
Ethnic Groupings

Similar presentations


 -Ireland (green) -Iceland.>")
 must choose two countries from Europe and create a PPT that teaches their classmates about those nations.>")