Download presentation
Presentation is loading. Please wait.

1
Simulation of single server queuing systems
Example 2: Grocery store with one checkout counter

2
Example 2: Grocery store with one checkout counter

4
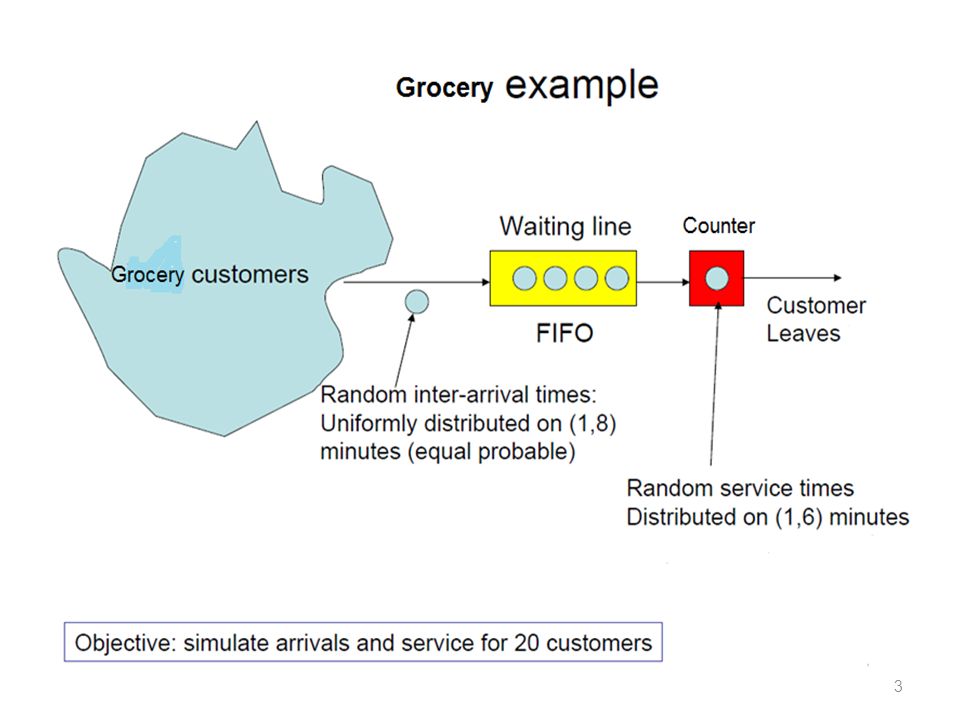
Example 2 grocery store with one checkout counter:
A small grocery store has only one checkout counter. Customers arrive at this checkout counter at random from 1 to 8 minutes apart. Each possible value of interarrival time has the same probability of occurrence, as shown in Table 2.6. The service times vary from 1 to 6 minutes with the probabilities shown in Table 2.7. The problem is to analyze the system by simulating the arrival and service of 20 customers. A set of uniformly distributed random numbers is needed to generate the arrivals at the checkout counter and another set is needed to generate service times. Random numbers have the following properties: 1. The set of random numbers is uniformly distributed between 0 and 1. 2. Successive random numbers are independent.

5
Simulation table : grocery store

6
System statistics Average time between arrival
(sum of all interarrival times)/(number of arrivals-1)=66/19 =3.47 Expected time between arrival E(T) =∑ ti*p(ti)= 1× × × × 0.125= OR: 0.125( ) =4.5 Average service time (total service time)/(total number of customer)=46/20=2.3 Expected service time E(S) =∑ si*p(si)= 1× × × × × ×0.05 =3.2 Average waiting time (total waiting time in queue)/(total number of customers) =46/20=2.3 Probability of waiting (number of customers who wait) /(total number of customers)=15/20=0.75 Probability of idle server (total idle server time)/(total run time of simulation) =8/72=0.11 The probability of the server being busy = =0.89
/(number of arrivals-1)=66/19 =3.47. Expected time between arrival. E(T) =∑ ti*p(ti)= 1× × × × 0.125= OR: 0.125( ) =4.5. Average service time. (total service time)/(total number of customer)=46/20=2.3. Expected service time. E(S) =∑ si*p(si)= 1× × × × × ×0.05 =3.2. Average waiting time. (total waiting time in queue)/(total number of customers) =46/20=2.3. Probability of waiting. (number of customers who wait) /(total number of customers)=15/20=0.75. Probability of idle server. (total idle server time)/(total run time of simulation) =8/72=0.11. The probability of the server being busy = =0.89.")
Similar presentations


 Little’s queuing formula This is independent of number of servers, queue discipline, interarrival time dist., service time.>")


>")

