Download presentation
Presentation is loading. Please wait.

6
Marion County Population: 56,598 Racial Makeup: 95.10% White, 3.22% Black,.2% Native American.4% Asian Number of Households: 23,652 Median Household Income: $28,626 Population Below Poverty Line: 16.30% City of Fairmont Population: 18,704 Racial Makeup: 88.9% White, 7.5% Black,.2% Native American,.6% Asian Number of Households: 8,133 Median Household Income: $25,628 Population Below Poverty Line: 20.1% City of Mannington Population: 2,063 Racial Makeup: 98.8% White,.2% Black,.2% Native American,.3% Asian Number of Households: 842 Median Household Income: $26,806 Population Below Poverty Line: 18.3% 2010 Census

7
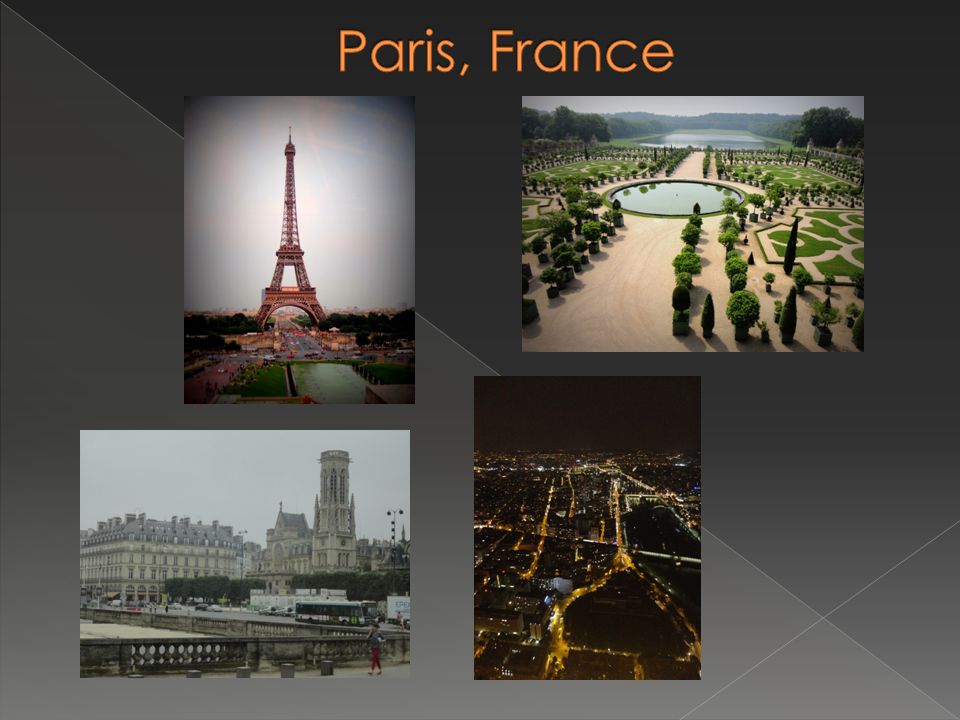
London, England Population: 8,308,000 Racial Makeup: 59.8% White, 20.9% Asian, 15.6% Black, Average Household Income: $42,477 Paris, France Population: 2,234,105 Racial Makeup: 85% White/European, 10% North African, 3.5% Black Average Household Income: $77,445 Rome, Italy Population: 2,863,322 Racial Makeup: 92% Italian, 1.8% Romanian, 1% North African Average Household Income: $21,756

8
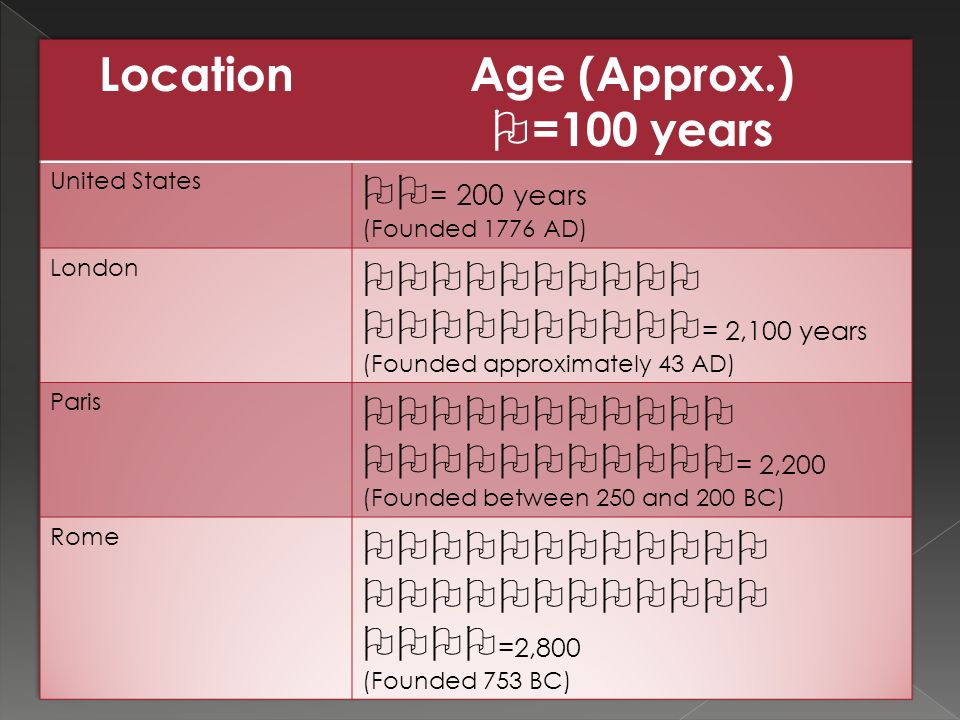
AreaPopulation (Approx.) = 100,000 Marion County =50,000 London = 8,300,000 Paris = 2,200,000 Rome = 2,800,000
 = 100,000 Marion County =50,000 London = 8,300,000 Paris = 2,200,000 Rome = 2,800,000")
9
LocationDistance from Fairmont =100 miles Morganton, West Virginia = 20 miles Pittsburgh, Pennsylvania =100 miles Charleston, West Virginia =200 miles London = 3,800 Paris = 3,900 Rome = 4,600

11
-Types of Government -Transportation -Housing -Education -Law Enforcement -Family Values -Societal Norms

12
SS.3.C.1: identify and explain the following commonly held American democratic values, principles and beliefs: diversity, rule of law, family values, community service, justice, liberty SS.3.C.1: determine the need for government and compare and contrast the following forms: tribal, monarchy, and democracy. SS.3.C.3: investigate significant cultural contributions of various groups creating our multicultural society. ELA.3.W.C9.2: write informative/explanatory texts to examine a topic and convey ideas and information clearly ELA.3.W.C11.1: conduct short research projects that build knowledge about a topic.

14
If I ran East Park…. Pretend you are the “king” or “queen” of East Park. Answer the following questions. Write your answers in complete sentences. Be ready to share your school rules with the class! What time does school begin and end? What is served for breakfast and lunch in the cafeteria? What subjects does your class study? What games do you play at recess? What are students and teachers required to wear? What are school funds used to purchase? How do you raise money for the school? If rules are broken, what is the punishment?

15
If I ran East Park…. Pretend you are the “king” or “queen” of East Park. Complete the following sentences. Be ready to share your school rules with the class! School begins at ________ and end at _________. _________ will be served for breakfast and ________ will be served for lunch. Our class will only study _________.We will play ______ at recess. Students are required to wear _______ and teachers are required to wear____. We will use school funds to purchase _______. We will raise money by ________.The punishment for broken rules will be _______.

17
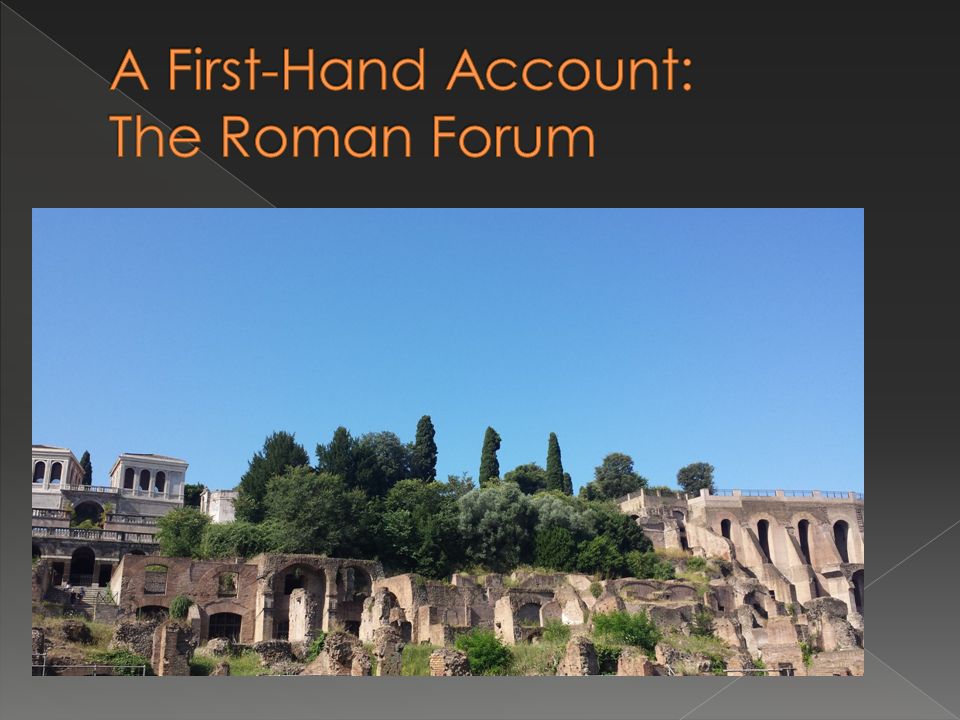
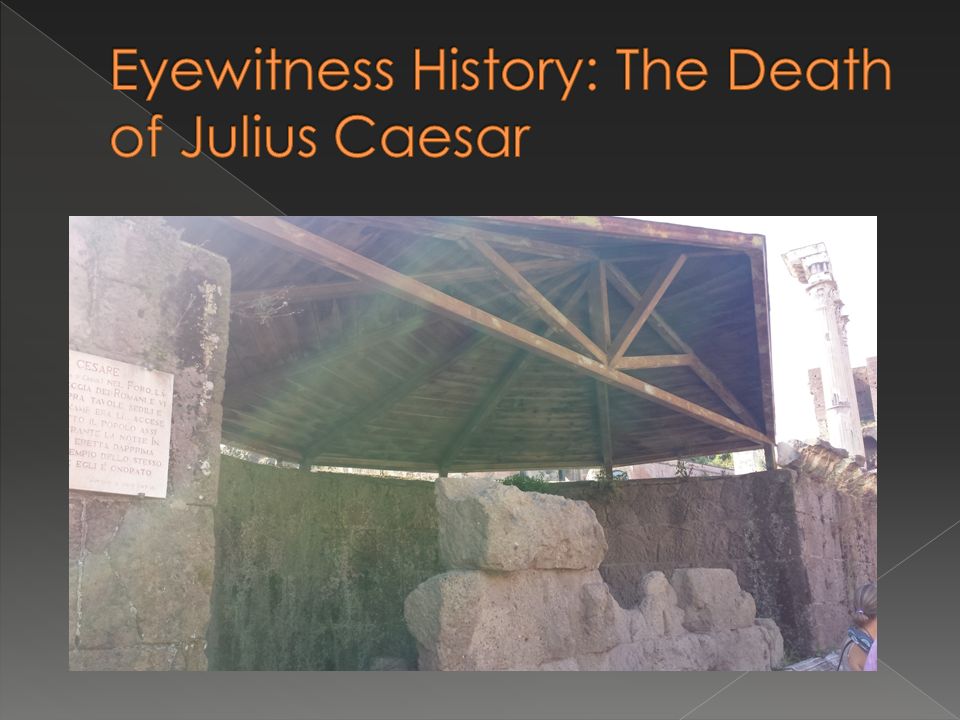
Through the use of pictures taken in Rome, as seen in the previous slide, students gain a sense of understanding of the geographical layout of Rome. Geographical layout of the Roman Forum emphasizes the social classes that existed during the Roman Republic

19
SS.9.G.1use different types of maps and geographic tools to analyze features on Earth to investigate and solve geographic questions. SS.9.G.6use maps, charts and graphs to analyze the world to account for consequences of human/environment interaction, and to depict the geographic implications of world events.

Similar presentations


 Explain the importance that Common Sense had on our country. 2) Explain the two main ideas in the Declaration of Independence that are.>")


