Download presentation
Presentation is loading. Please wait.

1
Population Ecology Scientists study the dynamics of population, change, and the factors that affect distribution/abundance of organisms

2
Characteristics of populations The following characteristics can be used to predict the future dynamics of a population Population Size Population Density Population Distribution Random, Uniform, Clumped Age Structure/ Sex Ratios Birth and Death Rates, Growth rate

3
Factors that influence population growth Limiting factors will prevent a population from growing forever Populations rise sharply at first, but them begin to level off as limiting factors become stronger and stabilizes the population Take a second to sketch a graph of this type of curve

4
Demography/Human Populations Demography is studying the statistical changes of human populations Can be used to predict populations and potential environmental impacts of populations

5
How did we get here? 7B+ humans Exponential growth Global growth rate peaked in the 1960’s and has declined since then Currently grows at 1.2% (this seems small)
.")
6
Is this a problem? Food production has balanced rapid growth in recent decades Can we maintain quality of life for all people? How do the views of Asian governments differ from those of European governments on this topic?

7
Studying Human Populations Population Size Doesn’t really tell us the entire story, need other factors Density/distribution of population Human populations tend to be clumped Age structure of population Rates of birth, death, immigration, emigration

9
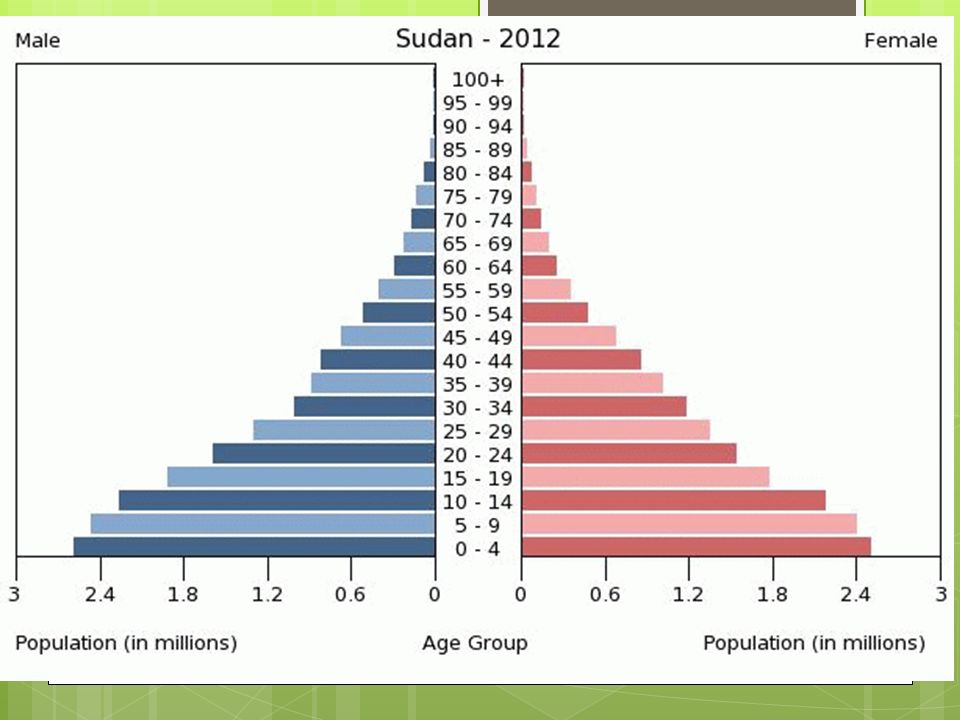
Under 15: Pre reproductive stage 15 – 65: Reproductive stage 65: Post reproductive stage

10
Interpreting age structure diagrams Interpret the following graphs:

11
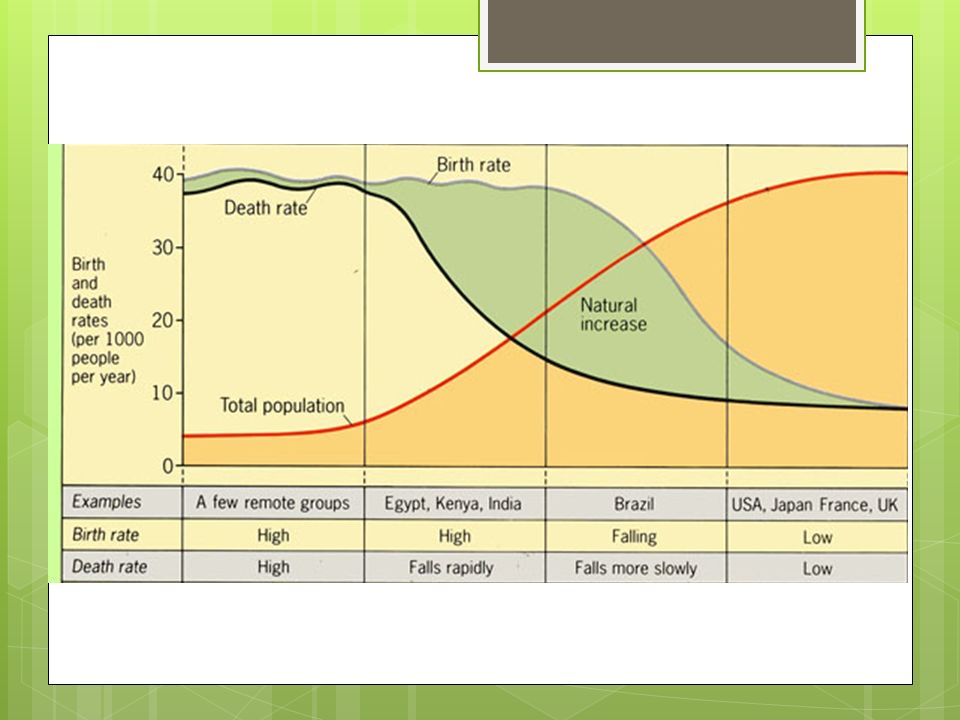
Demographic transitions Life Expectancy change due to living conditions (healthcare, sanitation, food supplies, need for labor) that can be linked to demographic transitions Pre-industrial stage High death and birth rates Relatively stable population Industrialization Low death, high birth rates Industrial Stage Low death, falling birth rates Post-Industrial Stage Low birth and death rates Population may be impacted by immigration
 that can be linked to demographic transitions Pre-industrial stage High death and birth rates Relatively stable population Industrialization Low death, high birth rates Industrial Stage Low death, falling birth rates Post-Industrial Stage Low birth and death rates Population may be impacted by immigration")
13
Demographics are linked to society Fertility Rates Total fertility rate: number of children an average woman has in her lifetime, should not fall below 2.1 Empowered woman Fertility rates drop when woman have access to birth control and education Population policies Most countries do not have a firm policy at this point, but encourage reproductive rates at or below 2.1 Poverty 99% of the next billion people will be born in developing nations More than 82% of people live in developing nations

14
Demographics are linked to society Some regions still have increasing death rates HIV/AIDS Overwhelming challenges faced by countries including Losing young and productive members of society to disease Educating Wars and conflicts

15
Birth & Death Rates Birth (natality) rate = the number of live births in a population over a specific unit of time.
 rate = the number of live births in a population over a specific unit of time.")
16
Birth & Death Rates Death (mortality) rate = the number of deaths in a population over a specific unit of time.
 rate = the number of deaths in a population over a specific unit of time.")
17
Changes in Populations Population growth: If the birth rate is greater than the death rate Increased Immigration (moving into an area)
")
18
Changes in Populations Population decline: If the birth rate is less than the death rate Increased Emigration (moving out of an area )
")
19
Survivorship Curves Shows the proportion of individual likely to survive to each age.

20
Typical Population Growth Curve Lag phase: Slow population growth

21
Typical Population Growth Curve Exponential growth phase: accelerated growth birth > death

22
Typical Population Growth Curve Stable Equilibrium phase: no growth birth = death

23
Carrying capacity The max. number of individuals that can be sustained or supported in an area.

24
Carrying capacity Not all organisms reach a carrying capacity bc. of limiting factors

25
Humans Population revisited Increasing human population growth rate is an increase in medical care Human population will ultimately reach a carrying capacity and stabilize.

26
What is our carrying capacity? Have we reached it? Warning signs??

27
Reproductive Strategies K Strategist Large organisms Long-lived Produce few offspring Provide substantial parental care

28
Reproductive Strategies K Strategist Usually occupy relatively stable environments. Reproductive strategy is to invest in a few, quality offspring. Rely on learning Elephants, humans, cougar Lower population growth

29
Reproductive Strategies r Strategist Small organisms Short-lived Produce many offspring Little if any parental care

30
Reproductive Strategies r Strategist Exploit unstable environments. Reproductive strategy is to produce large numbers of offspring to overcome high mortality.

31
Reproductive Strategies r Strategist Insects, fish, frogs Short lives High reproductive rate Rely on instinct

Similar presentations