Download presentation
Presentation is loading. Please wait.

1
CHAPTER 10 & 13 Correlation and Regression Instructor: Alaa saud Note: This PowerPoint is only a summary and your main source should be the book.

2
Outline: Introduction 10-1 Scatter plots and Correlation. 13-6 10-2 Regression. Note: This PowerPoint is only a summary and your main source should be the book.

3
The purpose of this chapter is to answer these questions statistically: 1. Are two or more variables related? 2. If so, what is the strength of the relationship? 3. What type of relationship exists? 4. What kind of predictions can be made from the relationship? Note: This PowerPoint is only a summary and your main source should be the book.

4
There are two types of relationships simple multiple In a simple relationship, there are two variables: an independent variable independent variable (predictor variable) dependent variable dependent variable (response variable). two or more independent variables one dependent variable In a multiple relationship, there are two or more independent variables that are used to predict one dependent variable. Note: This PowerPoint is only a summary and your main source should be the book.

5
Scatter Plots Note: This PowerPoint is only a summary and your main source should be the book.

6
scatter plot : A scatter plot :is a graph of the ordered pairs (x, y) of numbers consisting of the independent variable x and the dependent variable y. Note: This PowerPoint is only a summary and your main source should be the book.

7
Example 10- 1: Construct a scatter plot for the data shown for car rental companies in the United States for a recent year. Solution : Step 1: Draw and label the x and y axes. Step 2: Plot each point on the graph. Note: This PowerPoint is only a summary and your main source should be the book.

8
Dependent Independent Note: This PowerPoint is only a summary and your main source should be the book.

9
Construct a scatter plot for the data obtained in a study on the number of absences and the final grades of seven randomly selected students from a statistics class. Example 10-2: StudentNumber of absences x Final grade y A682 B286 C1543 D974 E1258 F590 G878 Note: This PowerPoint is only a summary and your main source should be the book.

10
Y X

11
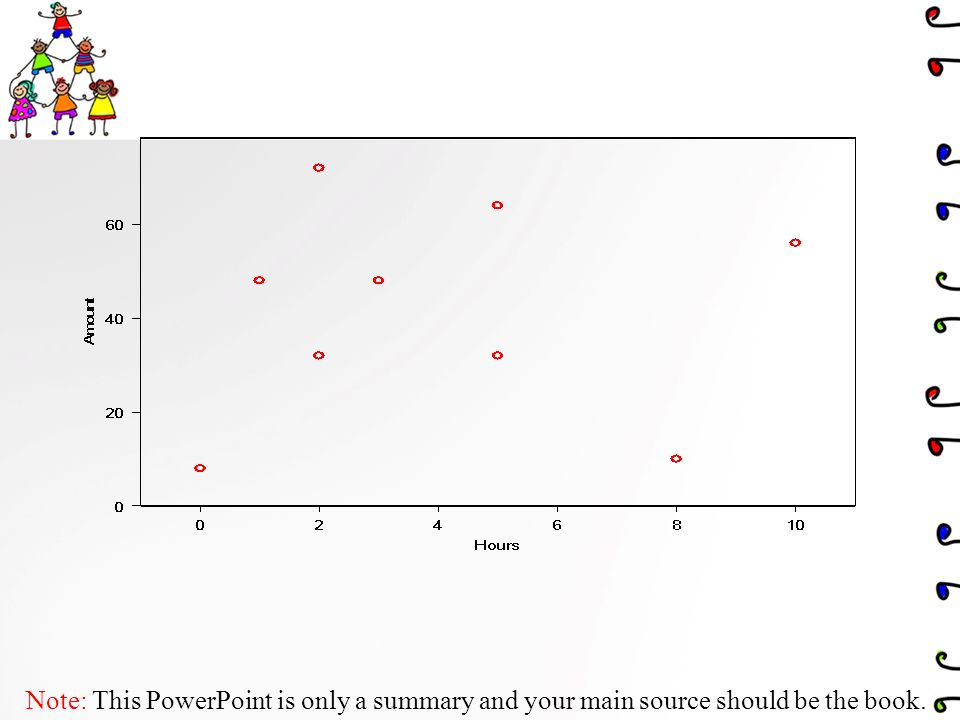
Example 10-3: Construct a scatter plot for the data obtained in a study on the number of hours that nine people exercise each week and the amount of milk (in ounces) each person consumes per week. StudentHours x Amount y A348 B08 C232 D564 E810 F532 G1056 H272 I148 Note: This PowerPoint is only a summary and your main source should be the book.

13
Positive Weak Negative Weak Positive strongPositive perfect Negative strong Negative perfect Note: This PowerPoint is only a summary and your main source should be the book.

14
No Relation Note: This PowerPoint is only a summary and your main source should be the book.

Similar presentations


 2) 3) 4) 5)>")

