Download presentation
Presentation is loading. Please wait.

2
Scatter Graphs Statistics

3
Example 1:- The diagram on the next slide shows the marks obtained in both Physics and Maths exams by a number of pupils. Can you make a general statement about the marks? On the diagram draw the line which in your opinion best fits the data. Use this line to estimate the following:- a) The mark for a pupil who missed his Maths exam but scored 72 in his Physics exam. b) The mark for a pupil who missed his Physics exam but scored 40 in his Maths exam.
 The mark for a pupil who missed his Maths exam but scored 72 in his Physics exam. b) The mark for a pupil who missed his Physics exam but scored 40 in his Maths exam..")
5
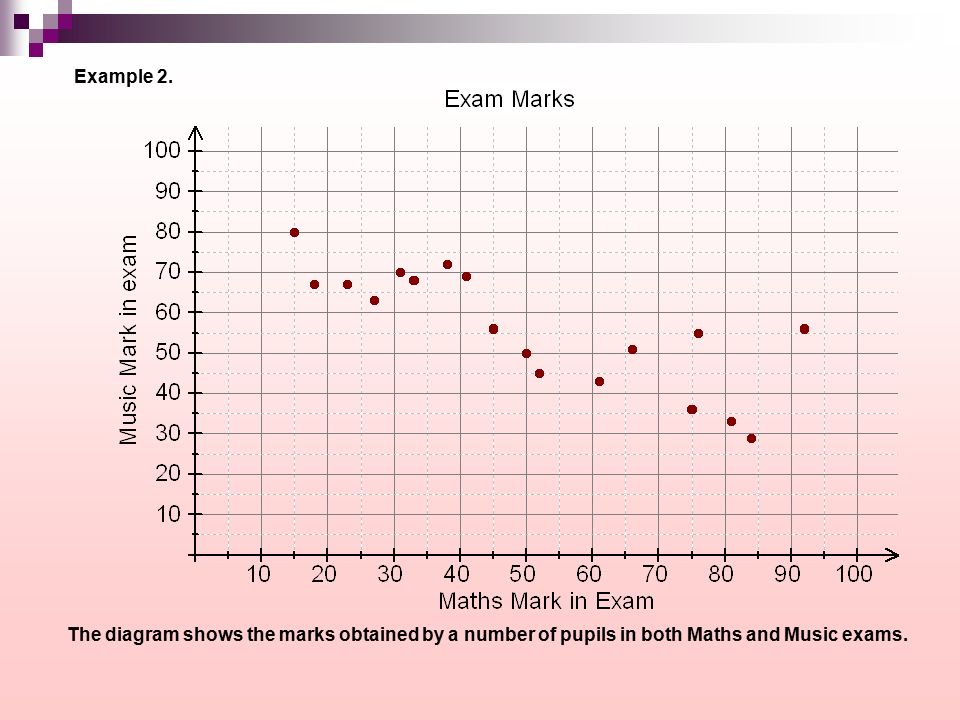
Example 2. The diagram shows the marks obtained by a number of pupils in both Maths and Music exams.

6
Can you make a general statement about the marks? On the diagram draw the line which in your opinion best fits the data. Use this line to estimate the following:- a) The mark for a pupil who missed his Maths exam but scored 38 in his Music exam. b) The mark for a pupil who missed his Music exam but scored 28 in his Maths exam.
 The mark for a pupil who missed his Maths exam but scored 38 in his Music exam. b) The mark for a pupil who missed his Music exam but scored 28 in his Maths exam..")
7
Example 3. The diagram shows the amount of damage caused by fires in houses (thousands of £ s ) and the corresponding response time by the Fire Brigade (minutes) in getting to that particular fire. Can you make a general statement about the graph?
 and the corresponding response time by the Fire Brigade (minutes) in getting to that particular fire. Can you make a general statement about the graph .")
8
On the diagram draw the line which, in your opinion, best fits the data. Use this line to estimate the following:- a)The expected cost of the damage for a house if it takes the Fire Brigade 10 minutes to get to the fire? b) The expected response time if it is hoped that damage could be kept below £2000.
The expected cost of the damage for a house if it takes the Fire Brigade 10 minutes to get to the fire. b) The expected response time if it is hoped that damage could be kept below £")
9
Example 4. The height h(cm) and the weight w(kg) of a number of pupils were measured. The results are shown in the scatter diagram. What can you say in general about the graph?

10
On the diagram draw the line which, in your opinion, best fits the data. Use this line to estimate the following:- a) The weight of a boy whose height is 165cm. b) The height of a pupil with a weight of 64kg.
 The weight of a boy whose height is 165cm. b) The height of a pupil with a weight of 64kg..")
11
Example 5. Tests were carried out on cars to find the length of the skid mark left after cars braked.

12
The scatter graph shows the results obtained in the trials. After an accident the skid mark was estimated to be 64cm. a) What does this tell you about the cars speed? b) What length of skid mark might be left by a car traveling at 95 km/hr.
 What does this tell you about the cars speed. b) What length of skid mark might be left by a car traveling at 95 km/hr..")
Similar presentations


 Statistics Tests are to be carried out on a new type of chicken food to see if the new food significantly increases the.>")

(2,4)(6,5)(1,8)(1,8)(1,1)(5,6)>")


