Download presentation
Presentation is loading. Please wait.

1
Health Care and Entitlements Jeff Rubin Department of Economics Rutgers University October 15, 2012

4
Percent Distribution of National Health Expenditures, by Source of Funds, 1960-2010 Source: Kaiser Family Foundation calculations using NHE data from Centers for Medicare and Medicaid Services, Office of the Actuary, National Health Statistics Group, at http://www.cms.hhs.gov/NationalHealthExpendData/ (see Historical; National Health Expenditures by type of service and source of funds, CY 1960-2010; file nhe2010.zip).http://www.cms.hhs.gov/NationalHealthExpendData/ Notes: Medicare and Medicaid were enacted in 1965; by January 1970, all states but two were participating in Medicaid. Starting with 2009 NHE data, CMS revised the “Source of Funds” measure from a classification that was either public or private to one that is more program-based. CMS’s rational was that “financing arrangements have become more complex and the lines between public and private payers have become blurred as a single program may have federal, state, local, and private funding.” As a result, the category “Other Third Party Payers” includes both public and private programs and also some programs that receive funds from both public and private sources, such as Workers’ Compensation, Worksite Health Care, and School Health. “Other Pub. Ins. Programs” includes CHIP, the Department of Defense, and the Department of Veterans Affairs.

5
Note: Dollar amounts in parentheses are the annual expenses per person in each percentile. Population is the civilian noninstitutionalized population, including those without any health care spending. Health care spending is total payments from all sources (including direct payments from individuals and families, private insurance, Medicare, Medicaid, and miscellaneous other sources) to hospitals, physicians, other providers (including dental care), and pharmacies; health insurance premiums are not included. Source: Kaiser Family Foundation calculations using data from U.S. Department of Health and Human Services, Agency for Healthcare Research and Quality, Medical Expenditure Panel Survey (MEPS), Household Component, 2009. Concentration of Health Care Spending in the U.S. Population, 2009 (≥$51,951)(≥$17,402)(≥$9,570)(≥$6,343)(≥$4,586)(≥$851)(<$851) Percent of Total Health Care Spending
 to hospitals, physicians, other providers (including dental care), and pharmacies; health insurance premiums are not included. Source: Kaiser Family Foundation calculations using data from U.S. Department of Health and Human Services, Agency for Healthcare Research and Quality, Medical Expenditure Panel Survey (MEPS), Household Component, Concentration of Health Care Spending in the U.S. Population, 2009 (≥$51,951)(≥$17,402)(≥$9,570)(≥$6,343)(≥$4,586)(≥$851)(<$851) Percent of Total Health Care Spending.")
6
Number of Nonelderly Uninsured Americans, 2004 – 2010 SOURCE: DeNavas-Walt C, Proctor B, and Smith J. “Income, Poverty, and Health Insurance Coverage in the United States: 2010”. United States Census Bureau. Issued September 2011.

7
Health Insurance Coverage of the Nonelderly Population, 2010 266.0 Million SOURCE: KCMU/Urban Institute analysis of 2011 ASEC Supplement to the CPS. Private Non- group 5.5%

8
Financial Consequences of Medical Bills by Insurance Status, 2009 NOTE: All differences between insured and uninsured are statistically significant (p<0.05). SOURCE: Kaiser Family Foundation Health Tracking Poll: August 2009. Percent of adults (age 18-64) reporting in past 12 months:
 reporting in past 12 months:.")
9
Diagnosis of Late-Stage Cancer Uninsured vs. Privately Insured NOTE: Odds ratios were adjusted for age, sex, race/ethnicity, facility type, region, and income and education on basis of postal code. They represent the odds of being diagnosed with stage III or state IV cancer vs. stage I cancer. Analysis based on cases occurring between 1998-2004. SOURCE: Kaiser Family Foundation, based on Halpern MT et al, Association of insurance status and ethnicity with cancer stage at diagnosis for 12 cancer sites: a retrospective analysis." The Lancet Oncology. March 2008. Equal likelihood between Uninsured and Insured Ratio of probability of diagnosis of late vs. early stage cancer, Uninsured/private insurance

10
Since The Start Of The Recession More Than 7 Million More Enrolled in Medicaid SOURCE: Analysis for KCMU by Health Management Associates, using compiled state Medicaid enrollment reports

11
Top 5% of Enrollees Accounted for More than Half of Medicaid Spending, FY 2009 SOURCE: KCMU/Urban Institute estimates based on data from FY 2009 MSIS and CMS-64, 2012.MSIS FY 2008 data were used for MA, PA, UT, and WI, but adjusted to 2009 CMS-64. Children 3.7% Adults 1.9% Children 0.3% Disabled 30.4% Total = 62.6 millionTotal = $346.5 billion Elderly 18.6% Bottom 95% of Spenders Top 5% Adults 0.2% Disabled 2.5% Elderly 2.0% Top 5% 5% 55% Bottom 95% of Spenders

12
Medicaid Enrollees and Expenditures, FY 2009 NOTE: Percentages may not add up to 100 due to rounding. SOURCE: KCMU/Urban Institute estimates based on data from FY 2009 MSIS and CMS-64, 2012.MSIS FY 2008 data were used for MA, PA, UT, and WI, but adjusted to 2009 CMS-64. Total = 62.6 millionTotal = $346.5 billion

20
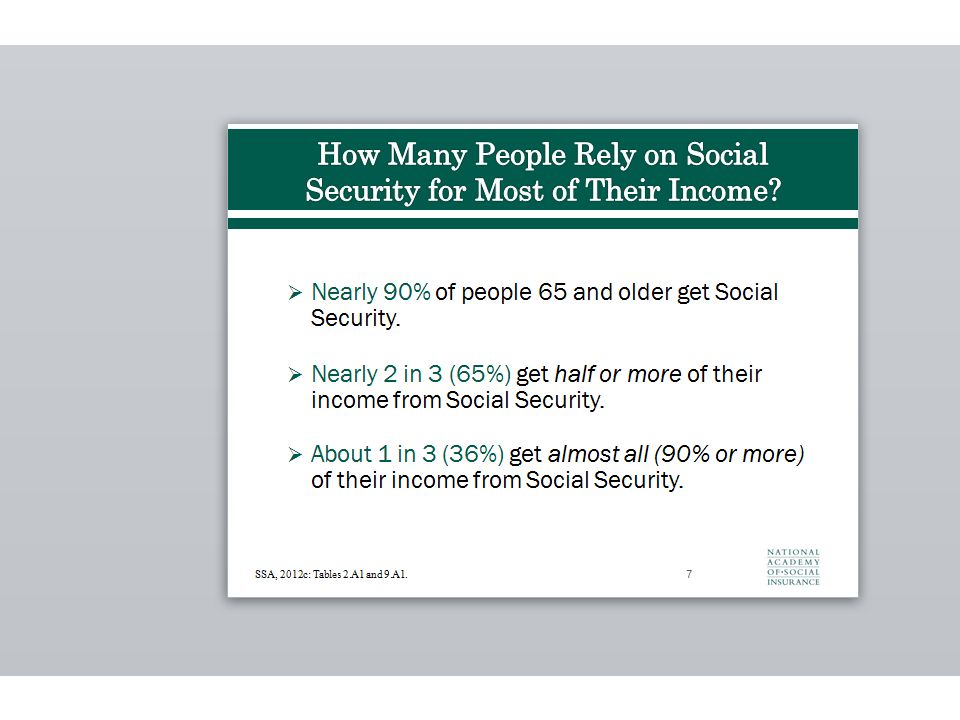
Social Security Options Trim benefits to highest earners Raise tax rate Raise tax base Raise retirement age Change COLA formula

21
Patient Protection and Affordable Care Act Mandate Health Insurance Create State-Based Health Insurance Exchanges Provide Subsidies to Reduce Cost of Insurance Expand Medicaid Eligibility (133% of poverty level; federal funding) Reduce Growth in Medicare Reimbursement Penalties for Firms with More than 50 Employees that Do Not Offer HI Excise Tax on High Cost Plans New Taxes on High Income Individuals to Finance Cost Guarantee Issue and Renewability Rating Variation Only on Age, Area, Family Comp. and Tobacco Use Eliminate Annual and Lifetime Limits Dependent Coverage for Children Up to 26 Years of Age Adjust Medicare Advantage Payments Cost Effectiveness Research Panel Eliminate Cost-Sharing for Preventive Services in Medicare Phase Out Doughnut Hole in Medicare Part D Reduces Deficit by $124 billion over 10 Years Test Alternative to Malpractice Laws From testimony of D. Elmendorf, CBO Director, March 30, 2011

Similar presentations


 implements broad, historic changes to U.S. health care Expanded access to health insurance and care.>")


>")


 MinnesotaCare General Assistance Medical Care (GAMC) Minnesota Comprehensive.>")