Download presentation
Presentation is loading. Please wait.

1
AP LAB #12 DISSOLVED OXYGEN Introduction to Water Quality & AP Lab #12 AP Lab #12 Ms. Gaynor AP Biology

2
Why is Water SO Important? It is a renewable resource that is becoming polluted & destroyed Recycles through “water (hydrologic) cycle” Recycles through “water (hydrologic) cycle” WATER = SURVIVAL ~ 80% of body = water Only 1% of water on Earth = fresh Used for domestic, industrial, commercial, & recreational use
 cycle Recycles through water (hydrologic) cycle WATER = SURVIVAL ~ 80% of body = water Only 1% of water on Earth = fresh Used for domestic, industrial, commercial, & recreational use.")
3
Why Test Water Quality? To monitor human and ecological impact and its affect on aquatic life/ aquatic habitats Monitoring means “to collect data” on water to access affects of pollutants Water quality can disrupt water chemistry harmful to aquatic food chain

4
AP LAB #12: Dissolved Oxygen Dissolved Oxygen (DO) = the amount of oxygen gas dissolved in water 95% more O 2 in air than in cold water [DO] used to determine whether the biological activities requiring O 2 are occurring ALSO an indicator of pollution O 2 important in metabolic processes indicator of water quality
![AP LAB #12: Dissolved Oxygen Dissolved Oxygen (DO) = the amount of oxygen gas dissolved in water 95% more O 2 in air than in cold water [DO] used to determine whether the biological activities requiring O 2 are occurring ALSO an indicator of pollution O 2 important in metabolic processes indicator of water quality](http://images.slideplayer.com/35/10364790/slides/slide_4.jpg "AP LAB #12: Dissolved Oxygen Dissolved Oxygen (DO) = the amount of oxygen gas dissolved in water 95% more O 2 in air than in cold water [DO] used to determine whether the biological activities requiring O 2 are occurring ALSO an indicator of pollution O 2 important in metabolic processes indicator of water quality")
5
Why is DO important? Oxygen must be in water in a free state (O 2 ) before organisms can use it This depends on physical and chemical properties of water. Sewage and detritus (dead organic matter) depletes DO b/c it requires a lot of O 2 as it decomposes
 before organisms can use it This depends on physical and chemical properties of water. Sewage and detritus (dead organic matter) depletes DO b/c it requires a lot of O 2 as it decomposes.")
6
1. primary productivity (photosynthesis) 2. Atmosphere (air) 3. Winds 4. Mixing (waves, currents etc…) How does the O 2 get into the water?
 How does the O 2 get into the water .")
7
6 MAIN Factors that affect [DO] 1. Air pressure above water affects [DO] Less O 2 present at higher elevations (b/c air is less dense) water at higher elevations contain less O 2
![6 MAIN Factors that affect [DO] 1.](http://images.slideplayer.com/35/10364790/slides/slide_7.jpg "Air pressure above water affects [DO] Less O 2 present at higher elevations (b/c air is less dense) water at higher elevations contain less O 2.")
8
6 MAIN Factors that affect [DO] (con’t) 2. Photosynthesis (adds O 2 ) & cell aerobic respiration (uses/takes away O 2 ) Photosynthesis in bright light aquatic producers make more O 2 Cellular Respiration (metabolic) activity aquatic organisms use more O 2
![6 MAIN Factors that affect [DO] (con’t) 2.](http://images.slideplayer.com/35/10364790/slides/slide_8.jpg "Photosynthesis (adds O 2 ) & cell aerobic respiration (uses/takes away O 2 ) Photosynthesis in bright light aquatic producers make more O 2 Cellular Respiration (metabolic) activity aquatic organisms use more O 2.")
9
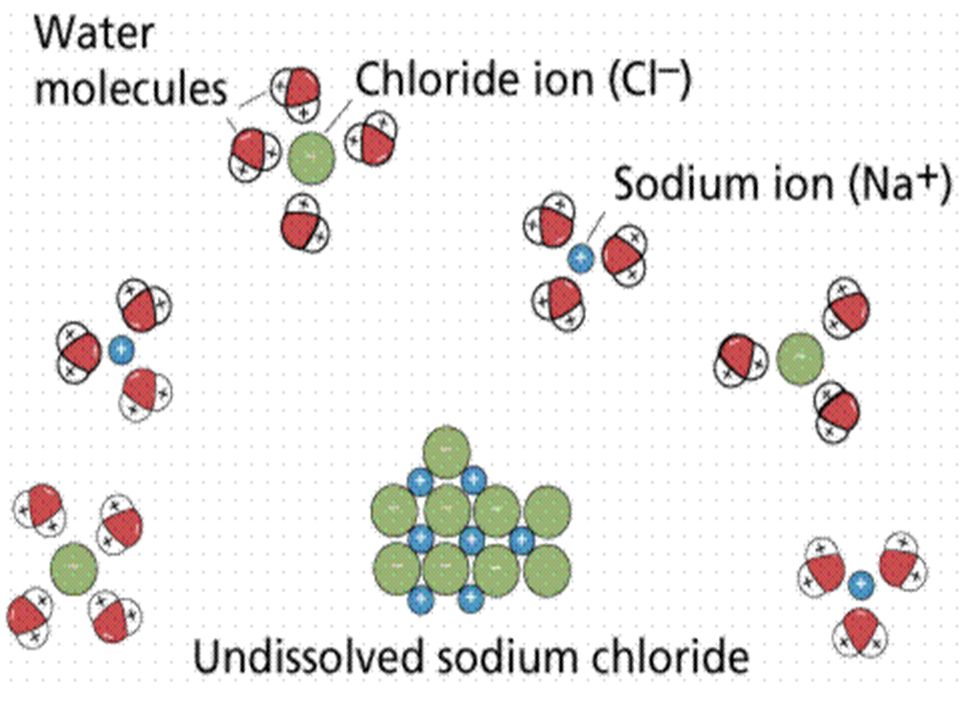
6 MAIN Factors that affect [DO] (con’t) 3. As salinity and temperature of water increases [DO] decreases Salinity Salinity = amount of salts dissolved in water More Salts= less [DO] Less Salts= more [DO] Temperature Warmer H 2 O = low [DO] Cold H 2 O = higher [DO]
![6 MAIN Factors that affect [DO] (con’t) 3.](http://images.slideplayer.com/35/10364790/slides/slide_9.jpg "As salinity and temperature of water increases [DO] decreases Salinity Salinity = amount of salts dissolved in water More Salts= less [DO] Less Salts= more [DO] Temperature Warmer H 2 O = low [DO] Cold H 2 O = higher [DO].")
11
6 MAIN Factors that affect [DO] (con’t) 4. Decomposition activity As organic (DEAD) material decays, microorganisms that decompose material consume oxygen (O 2 ) 5. Mixing and turbulence Wave action, waterfalls, and rapids all aerate (add “air” to) water and increase the O 2 concentration.
![6 MAIN Factors that affect [DO] (con’t) 4.](http://images.slideplayer.com/35/10364790/slides/slide_11.jpg "Decomposition activity As organic (DEAD) material decays, microorganisms that decompose material consume oxygen (O 2 ) 5. Mixing and turbulence Wave action, waterfalls, and rapids all aerate (add air to) water and increase the O 2 concentration..")
12
6 MAIN Factors that affect [DO] (con’t) 6. Wind Windless nights = low(er) [DO] High winds = High [DO]
![6 MAIN Factors that affect [DO] (con’t) 6.](http://images.slideplayer.com/35/10364790/slides/slide_12.jpg "Wind Windless nights = low(er) [DO] High winds = High [DO].")
13
Where is the greatest [DO]? lowest [DO]?
![Where is the greatest [DO] lowest [DO]](http://images.slideplayer.com/35/10364790/slides/slide_13.jpg "Where is the greatest [DO] lowest [DO]")
14
DO and Trophic States 2 classifications Eutrophic Eutrophic = “well nourished” high nutrient [ ] lots of plant life as well as respiration (O 2 fluctuates) GREENER in color (from algae) Oligotrophic Oligotrophic = l o w nutrient [ ] l o w plant growth (always rich in O 2 ) CLEAR in color, very “blue” Think: “Ewww” a green lake Think: “ O hhh” a nice clear blue lake
![DO and Trophic States 2 classifications Eutrophic Eutrophic = well nourished high nutrient [ ] lots of plant life as well as respiration (O 2 fluctuates) GREENER in color (from algae) Oligotrophic Oligotrophic = l o w nutrient [ ] l o w plant growth (always rich in O 2 ) CLEAR in color, very blue Think: Ewww a green lake Think: O hhh a nice clear blue lake](http://images.slideplayer.com/35/10364790/slides/slide_14.jpg "DO and Trophic States 2 classifications Eutrophic Eutrophic = well nourished high nutrient [ ] lots of plant life as well as respiration (O 2 fluctuates) GREENER in color (from algae) Oligotrophic Oligotrophic = l o w nutrient [ ] l o w plant growth (always rich in O 2 ) CLEAR in color, very blue Think: Ewww a green lake Think: O hhh a nice clear blue lake")
15
EUTROPHICOLIGOTROPHIC

16
Concepts dissolved O 2 (DO) primary productivity (aka-photosynthesis) measured in 3 ways: amount of CO 2 used rate of glucose/ sugar (biomass) formation rate of O 2 production net productivity vs. gross productivity cellular respiration Lab #12: Dissolved Oxygen

17
Reminder… PHOTOSYNTHESIS O 2 6CO 2 + 6H 2 O C 6 H 12 O 6 + 6 O 2 carbon water glucose oxygen gas dioxide (sugar) Cellular Respiration O 2 C 6 H 12 O 6 + 6 O 2 6CO 2 + 6H 2 O + ATP glucose oxygen gas carbon water energy (sugar) dioxide
 Cellular Respiration O 2 C 6 H 12 O O 2 6CO 2 + 6H 2 O + ATP glucose oxygen gas carbon water energy (sugar) dioxide")
18
As photosynthesis increases, oxygen levels increase: CO 2 + H 2 O Biomass + O 2 As respiration increases due to decay or organism’s need for ATP increases, oxygen levels decrease: Biomass + O 2 CO 2 + H 2 O Biological Influences & Dissolved Oxygen

19
Productivity in a Aquatic Environment Primary productivity = rate at which organic (carbon based) materials are stored through photosynthesis Can be measured in three ways: 1. The amt of carbon dioxide used 2. The rate of sugar formation 3. The rate of oxygen production

20
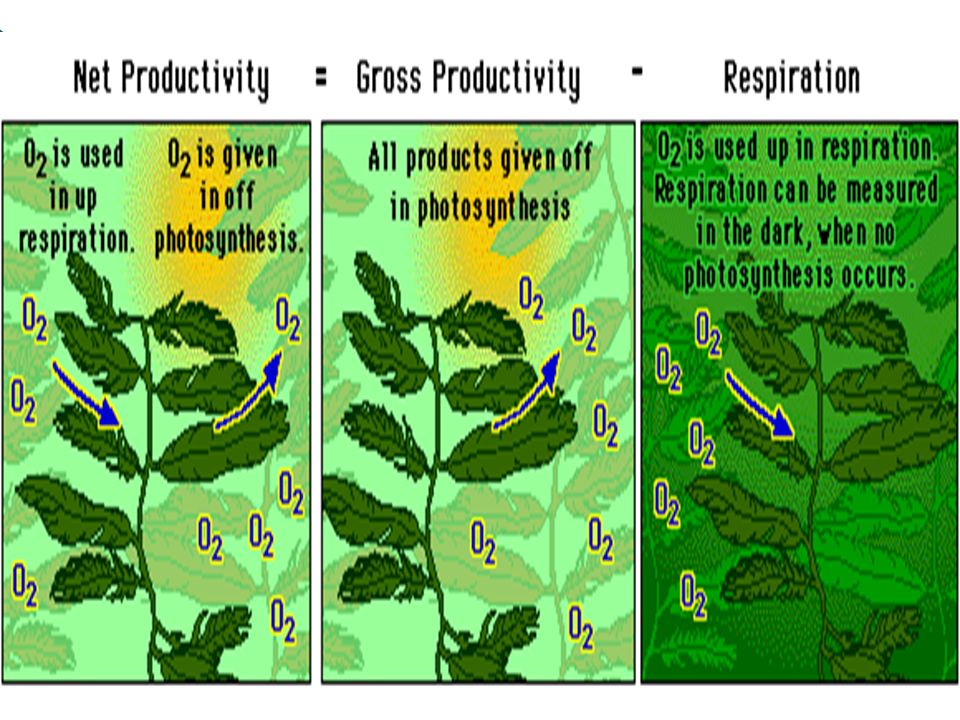
Productivity gross primary productivity (GPP) = TOTAL Photosynthesis ALL the sugar (biomass) made during photosynthesis Net productivity (NNP) = sugar (biomass) that remains after photosynthesis minus sugar being used up by cellular respiration P– CR = NP P– CR = NP net productivity = gross productivity – respiration
 = TOTAL Photosynthesis ALL the sugar (biomass) made during photosynthesis Net productivity (NNP) = sugar (biomass) that remains after photosynthesis minus sugar being used up by cellular respiration P– CR = NP P– CR = NP net productivity = gross productivity – respiration")
22
Light & Dark Bottle Method Light bottle represent daytime Dark bottle can represent night time BOTTLE #1 (5 light bottles 1 light control bottle) **exposed to light **Acts as initial bottle as well BOTTLE #2 (1 dark bottle) **NOT exposed to light
 **exposed to light **Acts as initial bottle as well BOTTLE #2 (1 dark bottle) **NOT exposed to light")
23
2004-2005

24
What is going on in the Light Bottles (2%, 10%, 25%, 65%, 100%) ?
")
25
What is going on in the Dark Bottle (foil wrapped) ?
")
26
Light Bottle - Dark Bottle = Gross PP +O 2 & -O 2 -O 2 only Total + O 2 Net PPNet PP = Light Bottle – Initial Bottle +O 2 & -O 2 starting [DO] Cellular RespirationCellular Respiration = Initial – Dark You need to isolate variables using the Light & Dark Bottle Method
![Light Bottle - Dark Bottle = Gross PP +O 2 & -O 2 -O 2 only Total + O 2 Net PPNet PP = Light Bottle – Initial Bottle +O 2 & -O 2 starting [DO] Cellular RespirationCellular Respiration = Initial – Dark You need to isolate variables using the Light & Dark Bottle Method](http://images.slideplayer.com/35/10364790/slides/slide_26.jpg "Light Bottle - Dark Bottle = Gross PP +O 2 & -O 2 -O 2 only Total + O 2 Net PPNet PP = Light Bottle – Initial Bottle +O 2 & -O 2 starting [DO] Cellular RespirationCellular Respiration = Initial – Dark You need to isolate variables using the Light & Dark Bottle Method")
28
This lab has 2 PARTS and will take 2 days! Lab #12: Experimental Design (setup)
")
29
Prepare 3 water sampling bottles filled with pond water Use 3 pond water samples from at different temperatures 1. refrigerator (cold) 2. incubator (warm) 3. room temperature DO NOT FORGET TO TAKE THE TEMPERATURE AT EACH CONDITION; RECORD ON WORKSHEETS! Determine the [DO] of each sample using the Winkler Titration Method. Record your values in your data table Estimate your % saturation using a nomogram Record class results Lab #12: Experimental Design (setup) PART A
 2. incubator (warm) 3. room temperature DO NOT FORGET TO TAKE THE TEMPERATURE AT EACH CONDITION; RECORD ON WORKSHEETS. Determine the [DO] of each sample using the Winkler Titration Method. Record your values in your data table Estimate your % saturation using a nomogram Record class results Lab #12: Experimental Design (setup) PART A.")
30
Nomograph To measure how much O 2 the water can hold (saturation), you need to be able to read a nomograph.
, you need to be able to read a nomograph.")
31
Fill 7 water sampling bottles with pond water (BOD bottles for “biological oxygen demand”) Add piece of plant to each bottle. Make sure that they are the same! Count leaves, measure, etc. CONTROL THE VARIABLES! Label bottles-I, D, 100%, 65%, 25%, 10%, and 2% Determine the DO for the initial bottle using Winkler Titration method. THIS IS YOUR BASE LINE (CONTROL GROUP); the amount of DO ALL your samples start with! Cover D (dark) bottle with aluminum foil Cover the remaining bottles with screens (see procedure for details) Place bottles under the light source. Wait 24 hours, then measure DO levels of remaining samples using Winkler Titration method. Lab #12: Experimental Design (setup) PART B
; the amount of DO ALL your samples start with. Cover D (dark) bottle with aluminum foil Cover the remaining bottles with screens (see procedure for details) Place bottles under the light source. Wait 24 hours, then measure DO levels of remaining samples using Winkler Titration method. Lab #12: Experimental Design (setup) PART B.")
32
2004-2005

33
Rinse sampling bottle 3x with sample water Submerge bottle in water; allow to fill. Tap bottle to release air bubbles You do NOT want extra atmospheric O2 While bottle is submerged, replace cap If there are air bubbles in the bottle, empty and repeat Preserve sample immediately. Test within 2 hours. Hints for Setting Up Lab #12

34
More Hints for Setting Up Lab #12 Do NOT leave water samples uncapped! Hello O 2 will get in!!! Use rubber bands to secure the screens NOTE: We are using HORNWORT plant not Anacharis Please FIX on your worksheets!

35
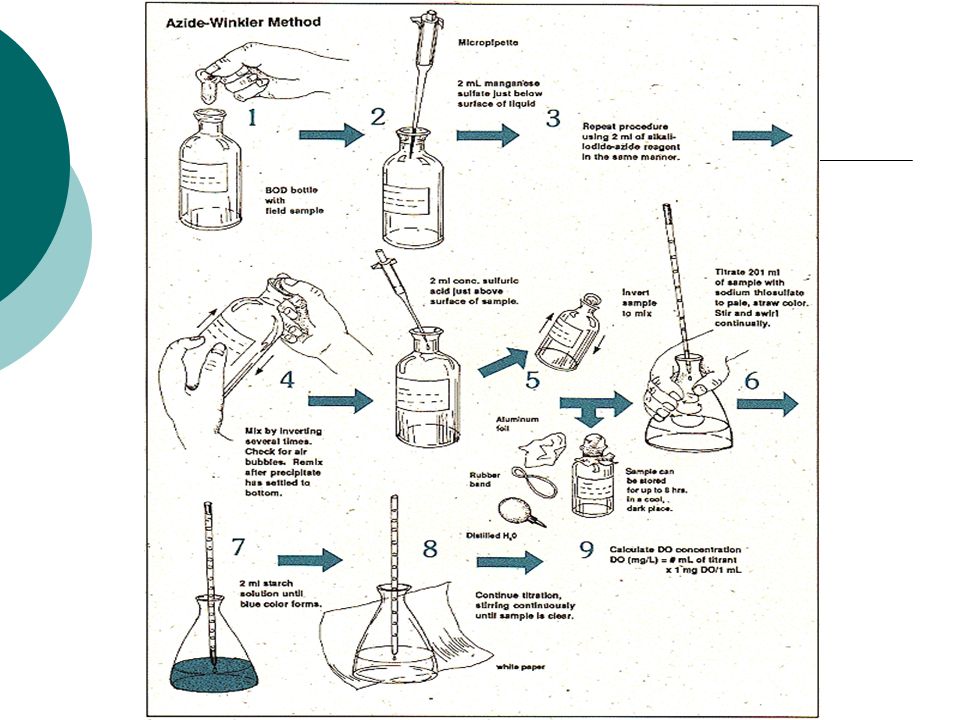
Winkler Titration Method (PART 1) How Do You FIX Samples Correctly? To “fix” your samples, follow for each sample bottle: (“fix” = trap DO in sample) 1. Uncap bottle 2. Add 8 drops of MgSO4 (manganous sulfate) to bottle (can cause cancer/stain) 3. Add 8 drops of alkaline potassium iodide azide to bottle (can cause cancer/stain) 4. Cap bottles and mix. A precipitate will form! Allow precipitate to settle to shoulder of bottle. 5. Add a spoonful (1 g) of sulfamic acid powder to bottle (STRONG ACID) 6. Cap and mix. Precipitate should dissolve!
 1. Uncap bottle 2. Add 8 drops of MgSO4 (manganous sulfate) to bottle (can cause cancer/stain) 3. Add 8 drops of alkaline potassium iodide azide to bottle (can cause cancer/stain) 4. Cap bottles and mix. A precipitate will form. Allow precipitate to settle to shoulder of bottle. 5. Add a spoonful (1 g) of sulfamic acid powder to bottle (STRONG ACID) 6. Cap and mix. Precipitate should dissolve!.")
36
Winkler Titration Method (PART 2) How Do You Determine the amount of DO in the samples Correctly? To determine the [DO] of your samples, follow for each sample bottle, including the initial bottle: 1. Uncap bottle 2. Carefully fill the titration tube/cup to the 20 mL line. 3. Fill the titration syringe to the “0” (zero) line with sodium thiosulfate. 4. Add 1 drop AT A TIME to sample and swirl after each drop. Do this until you get a FAINT yellow color. 5. Remove titration syringe 6. Add 8 drops of starch indicator solution 7. Swirl the sample. The sample should now be BLUE! No blue = no measurable [DO] or too much sodium thiosulfate 8. Add sodium thiosulfate 1 drop at a time and SWIRL until BLUE color disappears. If you finish the syringe and it is still blue, fill syringe again and continue. 9. Read titration syringe scale for result in mg DO/liter 10. Fill in data table; multiple DO in mg/L by 0.698 to convert to mL/L
 line with sodium thiosulfate. 4. Add 1 drop AT A TIME to sample and swirl after each drop. Do this until you get a FAINT yellow color. 5. Remove titration syringe 6. Add 8 drops of starch indicator solution 7. Swirl the sample. The sample should now be BLUE. No blue = no measurable [DO] or too much sodium thiosulfate 8. Add sodium thiosulfate 1 drop at a time and SWIRL until BLUE color disappears. If you finish the syringe and it is still blue, fill syringe again and continue. 9. Read titration syringe scale for result in mg DO/liter 10. Fill in data table; multiple DO in mg/L by to convert to mL/L.")
37
To Preserve DO: Done in the field O 2 + 2 Mn 2+ + 2H 2 O 2Mn(IV)O 2 + 4H + (pH >10) Allow precipitate to settle (reaction goes to completion) 2Mn(IV)O 2 + 4H + + 2I - Mn 2+ + I 2 (yellow) + 2H 2 O (low pH) DO is preserved (“fixed”) -------------------------------------------------------------------------- To Test Sample: This step can be done in the lab. Na 2 S 2 O 3 + 4I 2 + 5H 2 O 8I - + 2SO 4 2- + 10H + + Na + (the titration) Starch + I 2 blue (to improve endpoint determination) Chemical Reactions FIX SAMPLE
 Starch + I 2 blue (to improve endpoint determination) Chemical Reactions FIX SAMPLE.")
38
Amt of Thiosulfate Used = Amt of DO in water Titrate w/ Thiosulfate 20 mL STARTING POINT MIDDLE POINT Very DARK yellowPALE yellow Add 8 drops of STARCH Turns BLUE PART 1 PART 2

39
CONTINUE to Titrate w/ SAME 20 mL Thiosulfate END POINT Turns CLEAR!!! ADD ALL THIOSULFATE USED FROM STARTING POINT TO END POINT! This is your amount of thiosulfate used = amount of DO in water Each # = 1 mL = 1 ppm = 1 mg/L 1 mg/L x 0.698 = 1 mL/L 1 2 3 4 5 6 7 8 9 10

41
Can be measured in absolutes (how much O 2 is actually in the water) or by % saturation % saturation - measure of DO compared to how much DO COULD be in the water Water at a higher temperature CAN NOT hold as much oxygen as cold water (use nonmaogram) Dissolved Oxygen
 or by % saturation % saturation - measure of DO compared to how much DO COULD be in the water Water at a higher temperature CAN NOT hold as much oxygen as cold water (use nonmaogram) Dissolved Oxygen")
42
Conclusions to Think About… temperature = dissolved O 2 light = photosynthesis = O 2 production O 2 is consumed during cellular respiration respiration = dissolved O 2 (consumption of O 2 )
")
Similar presentations


 make organic compounds by photosynthesis. Chloroplast.>")

 A.Antibody B.Antigen C.Bacteria D.Pathogen.>")


 CE 370 - Lab. Introduction The Biochemical Oxygen Demand (BOD) test measures the oxygen consumed by microorganisms in.>")

 Water (from ground) Oxygen (to.>")


 Water (from ground) Oxygen (to air) Carbohydrate.>")
 as a measure of oxygen- demanding wastes in water. Distinguish between aerobic and anaerobic.>")
Oxygen is removed from the water by chemical reactions, the decay process and respiration. 2)Water temperature and atmospheric.>")
![Monitoring Dissolved Oxygen Levels In Wolf Run Creek [Modified Into Single PPT] By: Brandon Bell.](/16/4929762/big_thumb.jpg "Monitoring Dissolved Oxygen Levels In Wolf Run Creek [Modified Into Single PPT] By: Brandon Bell.>")
