Download presentation
Presentation is loading. Please wait.

1
E-Reading Rises as Device Ownership Jumps BY: KATHERINE ZICKUHR AND LEE RAINIE

2
Background of Project: Ebooks as a library service Growing, new service Personal interest myself OverDrive as the main Maryland vendor service

3
Credibility of Article: Published by the Pew Research Internet Project “Pew Research Center is a nonpartisan fact tank that informs the public about the issues, attitudes and trends shaping America and the world. It conducts public opinion polling, demographic research, media content analysis and other empirical social science research” (www.pewresearch.org). Lee Rainie is the director of internet, science, and technology at the Pew Research Center Gives speeches each year to government officials, media leaders, scholars and students, technology executives, librarians, and non-profit groups about the changing media ecosystem Zickuhr is a research analyst at the Pew Research Center’s Internet Project Focuses on the social impact technology has on libraries in the digital era

4
Topic: E-reading in America and current statistics As device ownership increases, so does the rate of ebooks being checked out of libraries Devices such as: e-readers (Kindle, Nook, etc.), tablets, smartphones, computers…) Ages affect the types of devices library patrons will read ebooks on
, tablets, smartphones, computers…) Ages affect the types of devices library patrons will read ebooks on")
5
The Problem: Not everyone has replaced print books for electronic versions (ebooks) Where do libraries stand? How do they know what percentage of their budgets should be allocated towards ebooks? What about classes? Should they cater to a certain age group? Is the library meeting the e-reading needs of the community? Libraries need to understand the current e-reading habits of Americans, and more specifically their community, in order to meet user demands and needs

6
Design and Methods of the Study: January 2-5 2014: Telephone interviews were conducted with a sample of 1,005 adults living in the continental U.S. Conducted via landline (500) and cell phone (505) –268 did NOT have a landline phone English and Spanish interviews Margin of sampling error +/- 3.5 For Landlines: Phone numbers were drawn with equal probabilities from active blocks (area code + exchange + two-digit block number) For Cell Phones: Drawn through systematic sampling from wireless 100-blocks and shared service 100- blocks
 and cell phone (505) –268 did NOT have a landline phone English and Spanish interviews Margin of sampling error +/- 3.5 For Landlines: Phone numbers were drawn with equal probabilities from active blocks (area code + exchange + two-digit block number) For Cell Phones: Drawn through systematic sampling from wireless 100-blocks and shared service 100- blocks.")
7
Design and Methods Continued: To maximize the chance of contacting someone: As many as three attempts to call someone were made Calls were staggered over different times during the days and different days during the week Interviews were conducted with whoever answered the phone (male or female) Interviewers had to verify that they were in a safe place and were an adult before answering any questions
 Interviewers had to verify that they were in a safe place and were an adult before answering any questions")
8
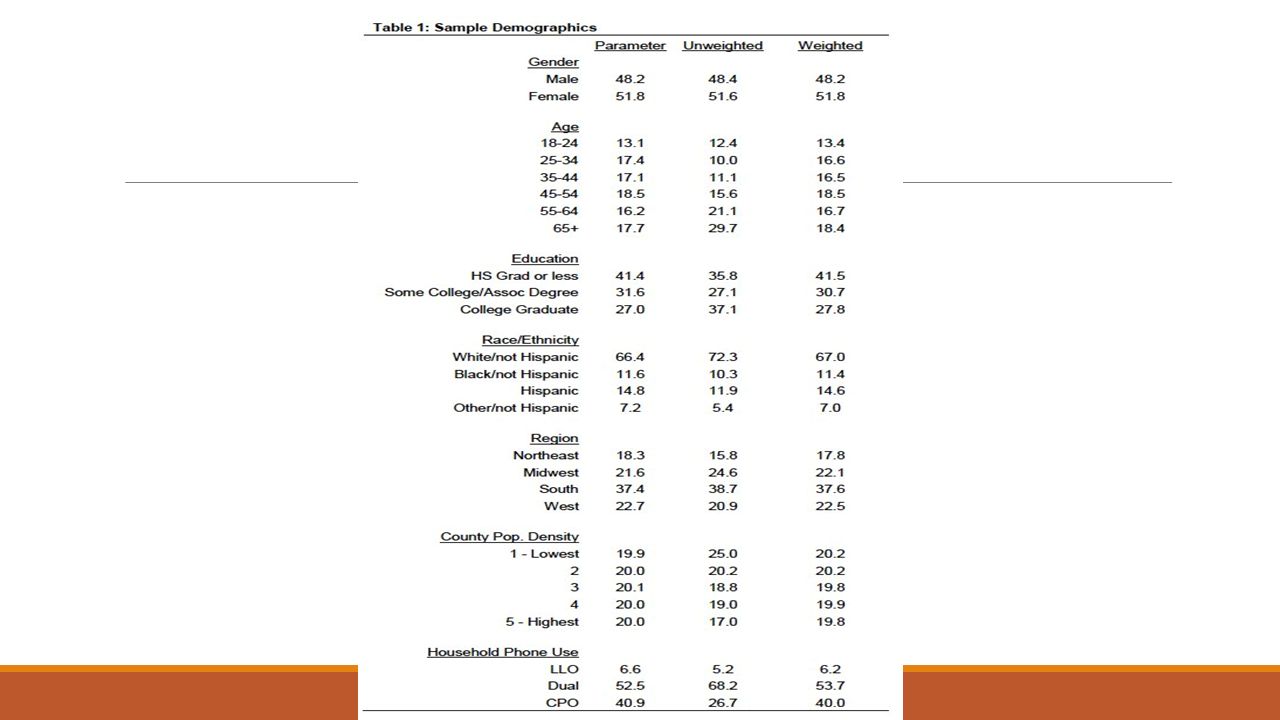
Data Analysis Weighting was used What is weighting? …generally used in survey analysis to compensate for sample designs and patterns of non-response that might bias results (www.pewinternet.org)www.pewinternet.org Sample of the study was weighted to match the national adult general population parameters “The first stage of weighting corrected for different probabilities of selection associated with the number of adults in each household and each respondent’s telephone usage patterns. 6 This weighting also adjusts for the overlapping landline and cell sample frames and the relative sizes of each frame and each sample” (Zickuhr & Rainie, 3). 6 “The second stage of weighting balanced sample demographics to population parameters. The sample is balanced to match national population parameters for sex, age, education, race, Hispanic origin, region (U.S. Census definitions), population density, and telephone usage. The basic weighting parameters came from the US Census Bureau’s 2012 American Community Survey data. 7 The population density parameter was derived from Census 2010 data. The telephone usage parameter came from an analysis of the January-June 2013 National Health Interview Survey” (Zickuhr & Rainie, 3). 7
. 6 The second stage of weighting balanced sample demographics to population parameters. The sample is balanced to match national population parameters for sex, age, education, race, Hispanic origin, region (U.S. Census definitions), population density, and telephone usage. The basic weighting parameters came from the US Census Bureau’s 2012 American Community Survey data. 7 The population density parameter was derived from Census 2010 data. The telephone usage parameter came from an analysis of the January-June 2013 National Health Interview Survey (Zickuhr & Rainie, 3). 7.")
10
Key Findings: In January 2014: 42% of adults owned tablet computers In September 2013: 34% 8% increase in just 4 months In January 2014: 32% owned an e-reader In September 2013: 24% 8% increase in 4 months E-reader devices increase after the holidays because people receive e-readers and tablets as gifts

11
Key Findings: In the past 12 months, 7 in 10 adults (69%) read a print book In the past 12 months, 28% read an ebook Libraries continue to buy print books and now more ebooks because… Younger adults are more likely to read ebooks than older adults E-reading rate among adult readers aged 65+ is 17% Ages 50-64 is 35% Ages 30-49 is 42% Ages 18-29 is 47% Age of library patrons using the ebook service will ultimately determine how much money libraries should spend on purchasing ebooks…the more demand, the more ebooks will need to be purchased in the future
 read a print book In the past 12 months, 28% read an ebook Libraries continue to buy print books and now more ebooks because… Younger adults are more likely to read ebooks than older adults E-reading rate among adult readers aged 65+ is 17% Ages is 35% Ages is 42% Ages is 47% Age of library patrons using the ebook service will ultimately determine how much money libraries should spend on purchasing ebooks…the more demand, the more ebooks will need to be purchased in the future")
12
Key Findings: Devices most commonly used to read ebooks on in 2014: 57% ereaders 55% tablets 29% computers 32% cell phones Gender plays an important role as well: 77% of men in survey group read ebooks on readers and 93% of women read ebooks on ereaders Libraries need to continue to offer classes teaching patrons how to access the ebook service via different technologies (tablets, ereaders, computers, cell phones).
.")
13
Conclusions: E-reading is on the rise Device ownership of tablets and ereaders is increasing Libraries need to offer the classes and/or education to patrons who want to use the ebook service Ebook title selection will become increasingly more important as the ebook service grows

14
My Assessment of Research Design: Easy to understand and follow Mixture of quantitative and qualitative methods Weighting was confusing at first until I researched a bit more Up to date and very accurate Graphs and numbers help readers understand the current state of e-reading habits in America Credible and reliable (authors, Pew Research, method) The different ways of calling people helped to make sure different demographics and people were contacted…to try as true of a measurement as possible
 The different ways of calling people helped to make sure different demographics and people were contacted…to try as true of a measurement as possible")
15
Work Cited Zickuhr, K., and Rainie, L. E-Reading Rises as Device Ownership Jumps. Pew Research Internet Project, 16 Jan. 2014. Web. 20 September 2014.

Similar presentations